
Problems
Overview
In Monitoring > Problems you can see what problems you currently have. Problems are those triggers that are in the "Problem" state.
By default, all new problems are classified as cause problems. It is possible to manually reclassify certain problems as symptom problems of the cause problem. For more details, see cause and symptom events.
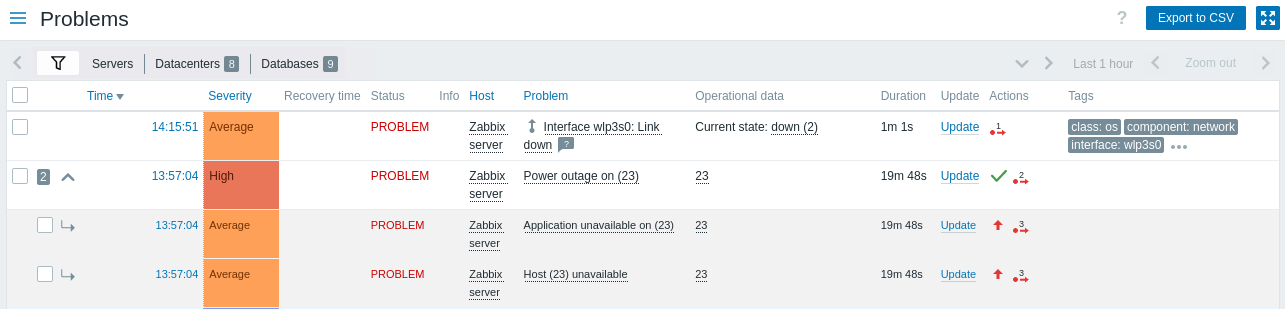
Problem details are displayed in a customizable table.
The  Customize table button in the table header lets you show, hide, or reorder columns, and reset the layout to default.
These options are also available:
Customize table button in the table header lets you show, hide, or reorder columns, and reset the layout to default.
These options are also available:
- Compact view - reduces row height to fit more problems on screen.
- Highlight full row - uses the problem severity color to highlight unresolved problems (not available in high-contrast themes).
You can also resize each column by dragging its right border; double-click the border to reset. All customizations are applied immediately and always remembered for the current user within the active filter tab (default or saved).
The following columns are available:
| Column | Description |
|---|---|
| Checkbox | Checkboxes for problem selection are displayed. Icons next to the checkboxes have the following meaning: |
| Time | Problem start time is displayed. Clicking the  Options button in the column header gives you access to the Show timeline option, which toggles the visual timeline and problem grouping (not available when Compact view is enabled). Options button in the column header gives you access to the Show timeline option, which toggles the visual timeline and problem grouping (not available when Compact view is enabled). |
| Severity | Problem severity is displayed. Problem severity is originally based on the severity of the underlying problem trigger, however, after the event has happened it can be updated using the Update problem screen. Color of the problem severity is used as cell background during problem time. |
| Recovery time | Problem resolution time is displayed This column is not available when Show in the filter is set to Problems. |
| Status | Problem status is displayed: Problem - unresolved problem Resolved - recently resolved problem. You can hide recently resolved problems using the filter. New and recently resolved problems blink for 2 minutes. Resolved problems are displayed for 5 minutes in total. Both of these values are configurable in Administration > General > Trigger displaying options. This column is not available when Show in the filter is set to Problems. |
| Info | A green information icon is displayed if a problem is closed by global correlation or manually when updating the problem. Hovering over the icon displays more details: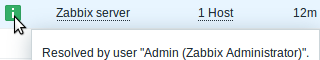 If a suppressed problem is shown, the following icon is displayed: 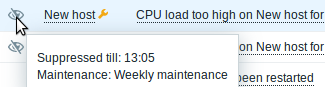 |
| Host | Problem host is displayed. Clicking the host name brings up the host menu. |
| Problem | Problem name is displayed. Problem name is based on the name of the underlying problem trigger. Macros in the trigger name are resolved at the time of the problem happening and the resolved values do not update any more. Clicking the problem name brings up the event menu. Hovering on the Clicking the Options button in the column header gives you access to two options:- Show operational data that displays operational data after the problem name in parentheses (only if the Operational data field is not empty in the trigger configuration). - Show trigger expression that displays the problem's trigger expression below the problem name (not available when Compact view is enabled). |
| Operational data | Dynamic, real-time data for the problem is displayed. The content depends on the Operational data field in trigger configuration: if a string with macros is defined, it is shown here; if the field is left empty, the latest values of all items in the trigger expression are shown instead. |
| Duration | Problem duration is displayed. See also: Negative problem duration |
| Update | Click the Update link to go to the problem update screen where various actions can be taken on the problem, including commenting and acknowledging the problem. |
| Actions | History of activities about the problem is displayed using symbolic icons: When rolling the mouse over the icons, popups with details about the activity are displayed. See viewing details to learn more about icons used in the popup for actions taken. |
| Tags | Problem tags are displayed. In addition, tags from an external ticketing system may also be displayed (see the Process tags option when configuring webhooks). Hovering or clicking the Clicking the Options button in the column header lets you set the number of tags displayed (1-3), choose how tag names are displayed (full, shortened, or none), set tag display priority, or duplicate the column (duplicated columns can be renamed or deleted). |
| Tag value | Problem tag values are displayed. Clicking the Options button in the column header lets you rename the column, choose which tag values to display, or duplicate the column (duplicated columns can be renamed or deleted). |
| Custom text | Custom text, macro values, or a combination of both is displayed. Clicking the Options button in the column header lets you rename the column, enter the custom text or macros, or duplicate the column (duplicated columns can be renamed or deleted).Supported macros: {HOST.*} (except {HOST.METADATA}), {INVENTORY.*}, {ITEM.*} (except {ITEM.STATE.ERROR}), {TRIGGER.ID}, {EVENT.ID}, and user macros. |
Negative problem duration
It is actually possible in some common situations to have negative problem duration i.e. when the problem resolution time is earlier than problem creation time, e. g.:
- If some host is monitored by proxy and a network error happens, leading to no data received from the proxy for a while, the nodata(/host/key) trigger will be fired by the server. When the connection is restored, the server will receive item data from the proxy having a time from the past. Then, the nodata(/host/key) problem will be resolved and it will have a negative problem duration;
- When item data that resolve the problem event are sent by Zabbix sender and contain a timestamp earlier than the problem creation time, a negative problem duration will also be displayed.
Negative problem duration is not affecting SLA calculation or Availability report of a particular trigger in any way; it neither reduces nor expands problem time.
Mass editing options
Buttons below the list offer some mass-editing options:
- Mass update - update the selected problems by navigating to the problem update screen
To use this option, mark the checkboxes before the respective problems, then click the Mass update button.
Buttons
The button to the right offers the following option:
 |
Export content from all pages to a CSV file. |
View mode buttons, being common for all sections, are described on the Monitoring page.
Using filter
You can use the filter to display only the problems you are interested in. For better search performance, data is searched with macros unresolved.
The filter is located above the table. Favorite filter settings can be saved as tabs and then quickly accessed by clicking the tabs above the filter.
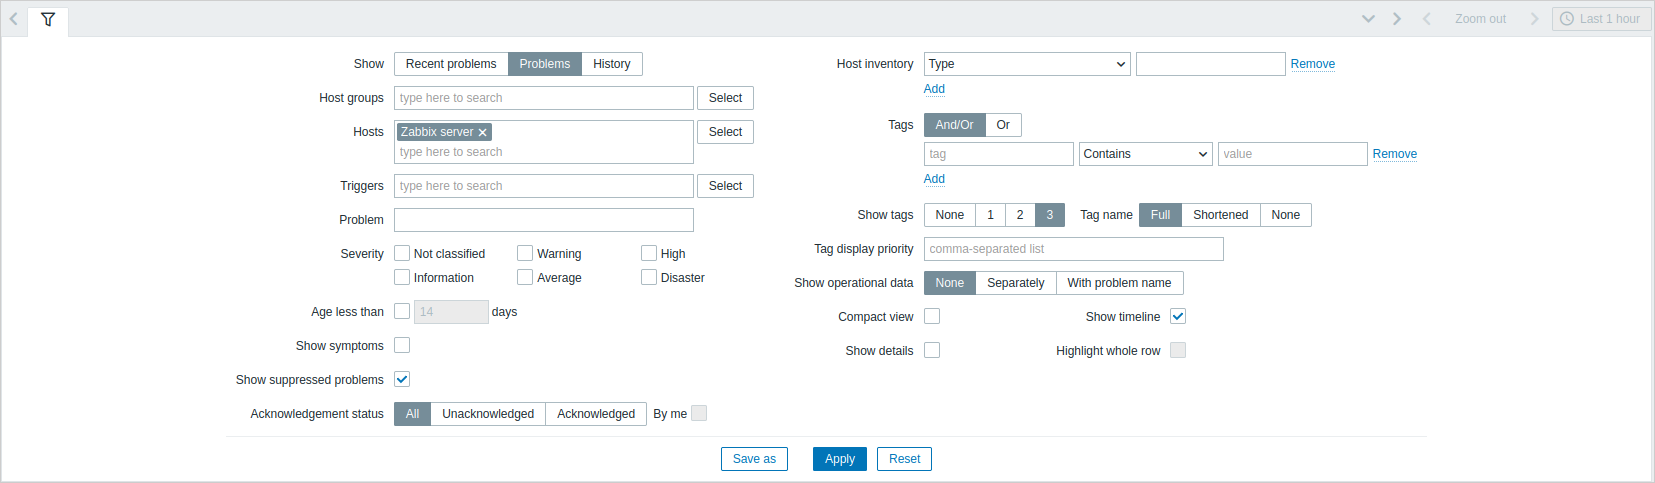
| Parameter | Description |
|---|---|
| Show | Filter by problem status: Recent problems - unresolved and recently resolved problems are displayed (default) Problems - unresolved problems are displayed History - history of all events is displayed |
| Host groups | Filter by one or more host groups. Specifying a parent host group implicitly selects all nested host groups. |
| Hosts | Filter by one or more hosts. |
| Triggers | Filter by one or more triggers. |
| Problem | Filter by problem name. |
| Severity | Filter by trigger (problem) severity. |
| Age less than | Filter by how old the problem is. |
| Host inventory | Filter by inventory type and value. |
| Tags | Filter by event tag name and value. It is possible to include as well as exclude specific tags and tag values. Several conditions can be set. Tag name matching is always case-sensitive. There are several operators available for each condition: Exists - include the specified tag names Equals - include the specified tag names and values (case-sensitive) Contains - include the specified tag names where the tag values contain the entered string (substring match, case-insensitive) Does not exist - exclude the specified tag names Does not equal - exclude the specified tag names and values (case-sensitive) Does not contain - exclude the specified tag names where the tag values contain the entered string (substring match, case-insensitive) There are two calculation types for conditions: And/Or - all conditions must be met, conditions having the same tag name will be grouped by the Or condition Or - enough if one condition is met When filtered, the tags specified here will be displayed first with the problem, unless overridden by the Tag display priority (see below) list. |
| Show symptoms | Mark the checkbox to display in its own line problems classified as symptoms. |
| Show suppressed problems | Mark the checkbox to display problems that would otherwise be suppressed and hidden because of host maintenance or suppressed manually by a user. |
| Acknowledgement status | Filter to display all problems, unacknowledged problems only, or acknowledged problems only. Mark the additional checkbox to filter out those problems ever acknowledged by you. |
Tabs for favorite filters
Frequently used sets of filter parameters can be saved in tabs.
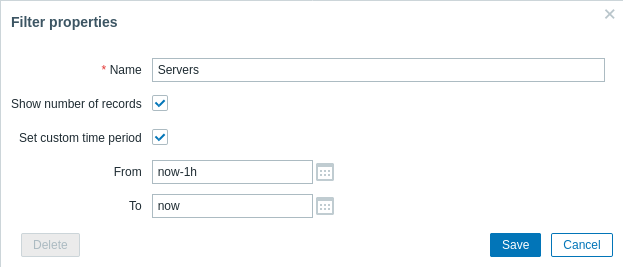
To save a new set of filter parameters, open the main tab, and configure the filter settings, then click the Save as button. In a new popup window, define Filter properties.
| Parameter | Description |
|---|---|
| Name | The name of the filter to display in the tab list. |
| Show number of records | Check, if you want the number of problems to be displayed next to the tab name. |
| Override time period selector | Check to set specific default time period for this filter set. If set, you will only be able to change the time period for this tab by updating filter settings. For tabs without a custom time period, the time range can be changed by clicking the time selector button in the upper-right corner (button name depends on selected time interval: This week, Last 30 minutes, Yesterday, etc.). This option is available only for filters in Monitoring > Problems. |
| From/To | Time period start and end in absolute (Y-m-d H:i:s) or relative time syntax (now-1d). Available if Set custom time period is checked. |
When saved, the filter is created as a named filter tab and immediately activated.
To edit the filter properties of an existing filter, click the gear symbol next to the active tab name.

Notes:
- To hide the filter area, click the name of the current tab. Click the active tab name again to open the filter area again.
- Keyboard navigation is supported: use arrows to switch between tabs, press Enter to open.
- The left/right buttons above the filter may be used to switch between saved filters. Alternatively, the downward pointing button opens a drop-down menu with all saved filters and you can click the one you need.
- If the settings of a saved filter have been changed (but not saved), a green dot is displayed after the filter name. To update the filter according to the new settings, click the Update button, which is displayed instead of the Save as button.
- Table column layout is saved per filter tab. To customize the layout of a saved filter, open that filter tab first, then customize the columns.
- Filter tabs, filter settings, and table column layout for each tab are remembered in the user profile and restored when the user opens the page again.
To share filters, copy and send to others a URL of an active filter.
After opening this URL, other users will be able to save this set of parameters as a permanent filter in their Zabbix account.
See also: Page parameters.
Filter buttons
 |
Apply specified filtering criteria (without saving). |
 |
Reset current filter and return to saved parameters of the current tab. On the main tab, this will clear the filter. |
 |
Save current filter parameters in a new tab. Only available on the main tab. |
 |
Replace tab parameters with currently specified parameters. Not available on the main tab. |
Viewing details
The times for problem start and recovery in Monitoring > Problems are links. Clicking them opens more details of the event.
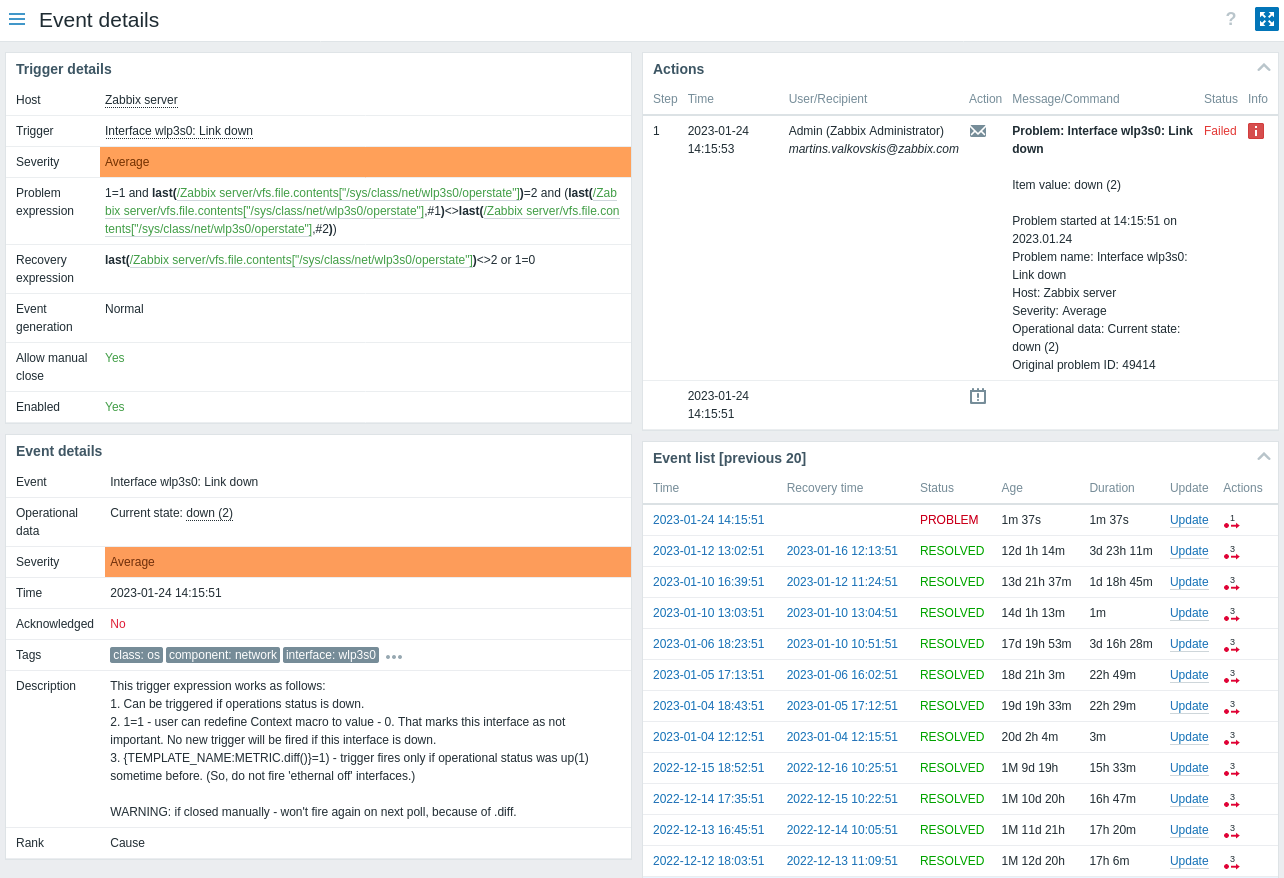
In event details, you can see whether the event was suppressed because of maintenance or suppressed manually by a user.
Note that the problem severity may differ for the trigger and the problem event - if it has been updated for the problem event using the Update problem screen.
In the action list, the following icons are used to denote the activity type:
 - problem event generated.
 - message has been sent.
 - problem event acknowledged.
 - problem event unacknowledged.
 - a comment has been added.
 - problem severity has been increased (e.g., Information > Warning).
 - problem severity has been decreased (e.g., Warning > Information).
 - problem severity has been changed, but returned to the original level (e.g., Warning > Information > Warning).
 - a remote command has been executed.
 - problem event has recovered.
 - the problem has been closed manually.
 - the problem has been suppressed.
 - the problem has been unsuppressed.
 - problem has been suppressed due to host maintenance.
 - problem has been unsuppressed after host maintenance.
 - the problem has been converted to a symptom problem.
 - the problem has been converted to a cause problem.