
16 Creating custom performance counter names for VMware
Overview
The VMware performance counter path has the
group/counter[rollup] format where:
group- the performance counter group, for example cpucounter- the performance counter name, for example usagemhzrollup- the performance counter rollup type, for example average
So the above example would give the following counter path:
cpu/usagemhz[average]
The performance counter group descriptions, counter names and rollup types can be found in VMware documentation.
It is possible to obtain internal names and create custom performance counter names by using script item in Zabbix.
Configuration
- Create disabled Script item on the main VMware host (where the eventlog[] item is present) with the following parameters:
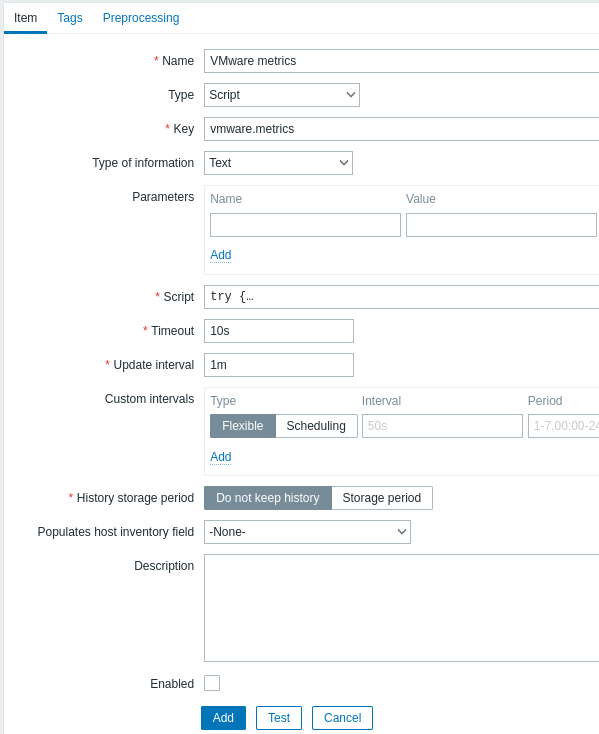
- Name: VMware metrics
- Type: Script
- Key: vmware.metrics
- Type of information: Text
- Script: copy and paste the script provided below
- Timeout: 10
- History storage period: Do not keep history
- Enabled: unmarked
Script
try {
    Zabbix.log(4, 'vmware metrics script');

    var result, resp,
    req = new HttpRequest();
    req.addHeader('Content-Type: application/xml');
    req.addHeader('SOAPAction: "urn:vim25/6.0"');

    login = '<soapenv:Envelope xmlns:soapenv="http://schemas.xmlsoap.org/soap/envelope/" xmlns:urn="urn:vim25">\
    <soapenv:Header/>\
    <soapenv:Body>\
        <urn:Login>\
            <urn:_this type="SessionManager">SessionManager</urn:_this>\
            <urn:userName>{$VMWARE.USERNAME}</urn:userName>\
            <urn:password>{$VMWARE.PASSWORD}</urn:password>\
        </urn:Login>\
    </soapenv:Body>\
</soapenv:Envelope>'
    resp = req.post("{$VMWARE.URL}", login);
    if (req.getStatus() != 200) {
        throw 'Response code: '+req.getStatus();
    }

    query = '<soapenv:Envelope xmlns:soapenv="http://schemas.xmlsoap.org/soap/envelope/" xmlns:urn="urn:vim25">\
<soapenv:Header/>\
    <soapenv:Body>\
        <urn:RetrieveProperties>\
            <urn:_this type="PropertyCollector">propertyCollector</urn:_this>\
            <urn:specSet>\
                <urn:propSet>\
                   <urn:type>PerformanceManager</urn:type>\
                   <urn:pathSet>perfCounter</urn:pathSet>\
                </urn:propSet>\
                <urn:objectSet>\
                   <urn:obj type="PerformanceManager">PerfMgr</urn:obj>\
                </urn:objectSet>\
            </urn:specSet>\
        </urn:RetrieveProperties>\
    </soapenv:Body>\
</soapenv:Envelope>'
    resp = req.post("{$VMWARE.URL}", query);
    if (req.getStatus() != 200) {
        throw 'Response code: '+req.getStatus();
    }
    Zabbix.log(4, 'vmware metrics=' + resp);
    result = resp;

    logout = '<soapenv:Envelope xmlns:soapenv="http://schemas.xmlsoap.org/soap/envelope/" xmlns:urn="urn:vim25">\
    <soapenv:Header/>\
    <soapenv:Body>\
        <urn:Logout>\
            <urn:_this type="SessionManager">SessionManager</urn:_this>\
        </urn:Logout>\
    </soapenv:Body>\
</soapenv:Envelope>'

    resp = req.post("{$VMWARE.URL}",logout);
    if (req.getStatus() != 200) {
        throw 'Response code: '+req.getStatus();
    }

} catch (error) {
    Zabbix.log(4, 'vmware call failed : '+error);
    result = {};
}

return result;
Once the item is configured, press Test button, then press Get value.
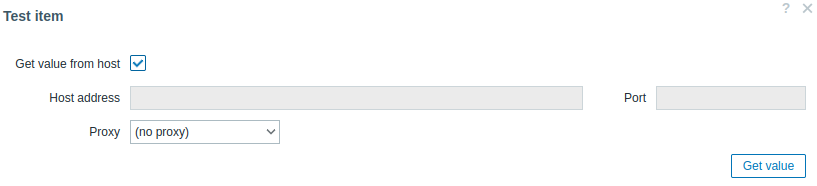
Copy received XML to any XML formatter and find the desired metric.
An example of XML for one metric:
<PerfCounterInfo xsi:type="PerfCounterInfo">
    <key>6</key>
    <nameInfo>
        <label>Usage in MHz</label>
        <summary>CPU usage in megahertz during the interval</summary>
        <key>usagemhz</key>
    </nameInfo>
    <groupInfo>
        <label>CPU</label>
        <summary>CPU</summary>
        <key>cpu</key>
    </groupInfo>
    <unitInfo>
        <label>MHz</label>
        <summary>Megahertz</summary>
        <key>megaHertz</key>
    </unitInfo>
    <rollupType>average</rollupType>
    <statsType>rate</statsType>
    <level>1</level>
    <perDeviceLevel>3</perDeviceLevel>
</PerfCounterInfo>
Use XPath to extract the counter path from received XML. For the example above, the XPath will be:
| field | xPath | value |
|---|---|---|
| group | //groupInfo[../key=6]/key | cpu |
| counter | //nameInfo[../key=6]/key | usagemhz |
| rollup | //rollupType[../key=6] | average |
Resulting performance counter path in this case is: cpu/usagemhz[average]