
4 Aggregation in graphs
Overview
The aggregation functions, available in the graph widget of the dashboard, allow displaying an aggregated value for the chosen interval (5 minutes, an hour, a day), instead of all values.
The aggregation options are as follows:
- min
- max
- avg
- count
- sum
- first (first value displayed)
- last (last value displayed)
The most exciting use of data aggregation is the possibility to create nice side-by-side comparisons of data for some period:
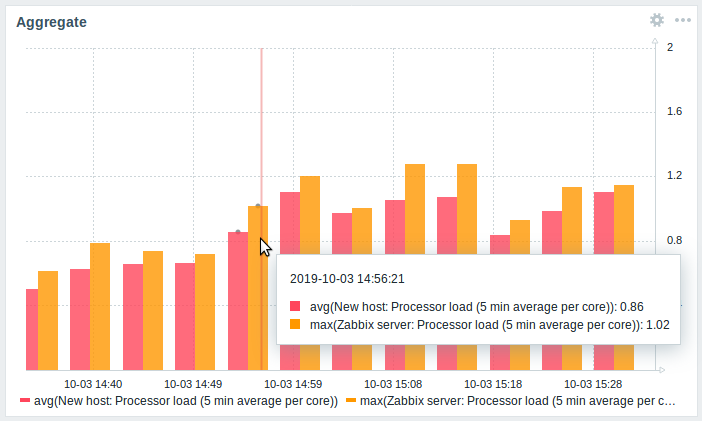
When hovering over a point in time in the graph, date and time is displayed in addition to items and their aggregated values. Items are displayed in parentheses, prefixed by the aggregation function used. If the graph widget has a Data set label configured, the label is displayed in parentheses, prefixed by the aggregation function used. Note that this is the date and time of the point in the graph, not of the actual values.
Configuration
The options for aggregation are available in data set settings when configuring a graph widget.
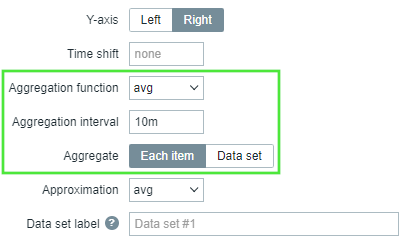
You may pick the aggregation function and the time interval. As the data set may comprise several items, there is also another option allowing to show aggregated data for each item separately or for all data set items as one aggregated value.
Use cases
Average request count to Nginx server
View the average request count per second per day to the Nginx server:
- add the request count per second item to the data set
- select the aggregate function
avgand specify interval1d - a bar graph is displayed, where each bar represents the average number of requests per second per day
Minimum weekly disk space among clusters
View the lowest disk space among clusters over a week.
- add to the data set: hosts
cluster*, key "Free disk space on /data" - select the aggregate function
minand specify interval1w - a bar graph is displayed, where each bar represents the minimum disk space per week for each /data volume of the cluster