
2 Monitor Windows with Zabbix agent
Introduction
This page walks you through the steps required to start basic monitoring of Windows machines with Zabbix.
Who this guide is for
This guide is designed for new Zabbix users and contains the minimum set of steps required to enable basic monitoring of your Windows machine. If you are looking for deep customization options or require more advanced configuration, see Configuration section of Zabbix manual.
Prerequisites
Before proceeding with this installation guide, you must download and install Zabbix server and Zabbix frontend according to instructions for your OS.
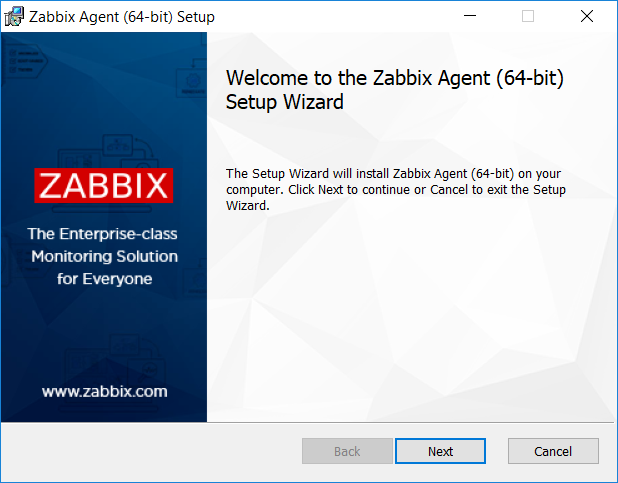
Install Zabbix agent
Zabbix agent is the process responsible for gathering data. You need to install it on the Windows machine that you want to monitor. Follow Zabbix agent installation instructions for Windows.
Configure Zabbix for monitoring
Zabbix agent can collect metrics in active or passive mode (simultaneously).
A passive check is a simple data request. Zabbix server or proxy asks for some data (for example, CPU load) and Zabbix agent sends back the result to the server. Active checks require more complex processing. The agent must first retrieve from the server(s) a list of items for independent processing and then bulk send the data back. See Passive and active agent checks for more info.
Monitoring templates provided by Zabbix usually offer two alternatives - a template for Zabbix agent and a template for Zabbix agent (active). With the first option, the agent will collect metrics in passive mode. Such templates will deliver identical monitoring results, but using different communication protocols.
Further Zabbix configuration depends on whether you select a template for active or passive Zabbix agent checks.
Passive checks
Zabbix frontend
1. Log into Zabbix frontend.
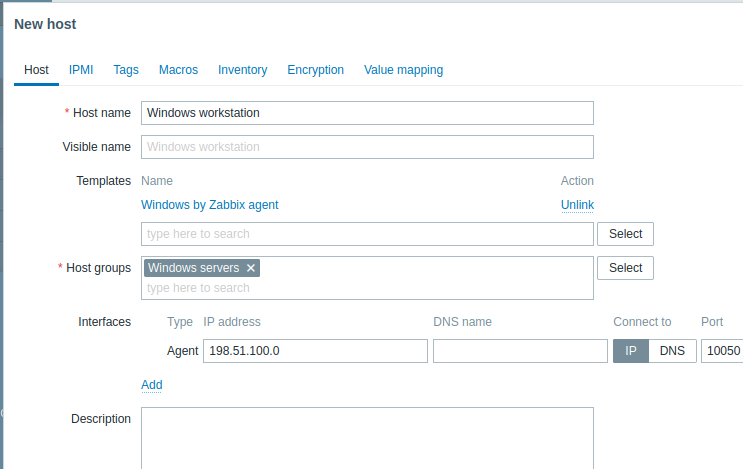
2. Create a host in Zabbix web interface.
This host will represent your Windows machine.
3. In the Interfaces parameter, add Agent interface and specify the IP address or DNS name of the Windows machine where the agent is installed.
4. In the Templates parameter, type or select Windows by Zabbix agent.
Zabbix agent
For passive checks Zabbix agent needs to know the IP address or DNS name of Zabbix server. If you
have provided correct information during the agent installation, the configuration file is already updated. Otherwise, you
need to manually specify it. Go to the C:\Program files\Zabbix Agent folder, open the file
zabbix_agentd.conf and add the IP/DNS of your Zabbix server to the Server parameter.
Example:
Server=192.0.2.22Active checks
Zabbix frontend
1. Log in to Zabbix frontend.
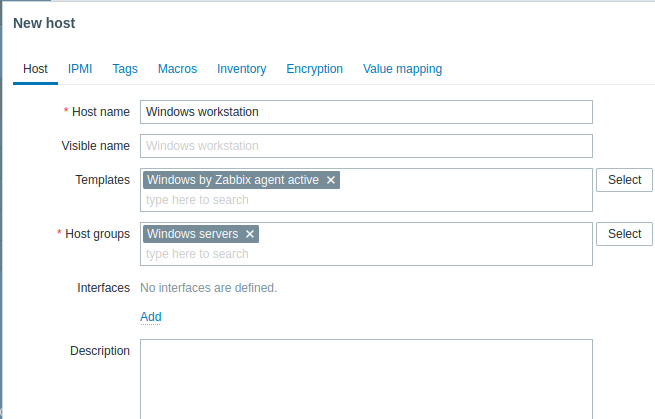
2. Create a host in Zabbix web interface.
This host will represent your Windows machine.
3. In the Templates parameter, type or select Windows by Zabbix agent active.
Zabbix agent
In the C:\Program files\Zabbix Agent folder open the file zabbix_agentd.conf and add:
- The name of the host you created in Zabbix web interface to the Hostname parameter.
- The IP address or DNS name of your Zabbix server machine to the ServerActive parameter (might be prefilled if you have provided it during Zabbix agent setup).
Example:
ServerActive= 192.0.2.22
Hostname=Windows workstation
View collected metrics
Congratulations! At this point, Zabbix is already monitoring your Windows machine.
To view collected metrics, open the Monitoring->Hosts menu section and click on the Latest data next to the host.

Set up problem alerts
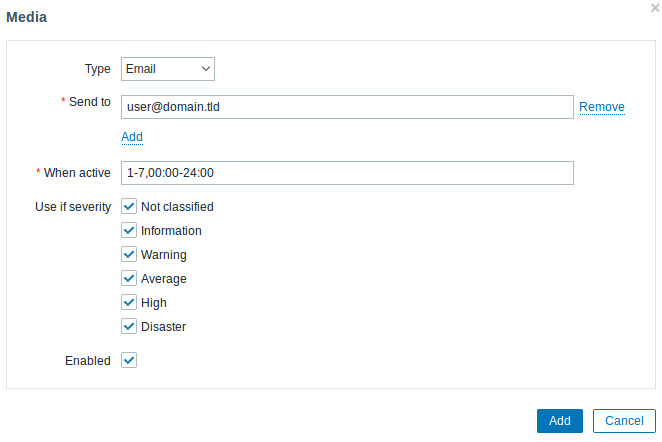
Zabbix can notify you about a problem with your infrastructure using a variety of methods. This guide provides configuration steps for sending email alerts.
1. Go to the User settings -> Profile, switch to the tab Media and add your email.
2. Follow the guide for Receiving problem notification.
Next time, when Zabbix detects a problem you should receive an alert via email.
On Windows, you can use CpuStres utility to simulate high CPU load and as a result receive a problem alert.
See also:
- Creating an item - how to start monitoring additional metrics (custom monitoring without templates).
- Zabbix agent items, Zabbix agent items for Windows - full list of metrics you can monitor using Zabbix agent on Windows.
- Problem escalations - how to create multi-step alert scenarios (e.g., first send message to the system administrator, then, if a problem is not resolved in 45 minutes, send message to the data center manager).