
3 Monitor Apache via HTTP
Introduction
This page shows a quick and simple way to start monitoring an Apache web server without installing any additional software.
Who this guide is for
This guide is designed for new Zabbix users and contains the minimum set of steps required to enable basic monitoring of your Apache installation. If you are looking for deep customization options or require more advanced configuration, see Configuration section of Zabbix manual.
Prerequisites
Before proceeding with this installation guide, you must download and install Zabbix server and Zabbix frontend according to instructions for your OS.
Prepare Apache
1. Check, which Apache version you are using:
On RHEL-based system, run:
httpd -vOn Debian/Ubuntu, run:
apache2 -v2. Make sure that the Status module is enabled in your Apache instance.
On RHEL-based system, run:
httpd -M | grep status
status_module (shared)
On Debian/Ubuntu, run:
apache2ctl -M | grep status
status_module (shared)
If you don't see status_module in the list, enable the module by running:
On RHEL-based system, run:
LoadModule status_module /usr/lib/apache2/modules/mod_status.soOn Debian/Ubuntu, run:
sudo /usr/sbin/a2enmod status3. Edit Apache configuration file to allow access to status reports from Zabbix server IP.
On an RHEL-based system: /etc/httpd/conf.modules.d/status.conf:
sudo vi /etc/httpd/conf.modules.d/status.confOn Debian/Ubuntu: /etc/apache2/mods-enabled/status.conf:
sudo vi /etc/apache2/mods-enabled/status.confAdd the following lines to the file (replace 198.51.100.255 with your Zabbix server IP address):
-
For Apache 2.2:
<Location /server-status> SetHandler server-statusOrder Deny,Allow Deny from all Allow from 198.51.100.255 </Location>
-
For Apache 2.4:
<Location "/server-status"> SetHandler server-status Require ip 198.51.100.255 </Location>
4. Restart Apache
On an RHEL-based system, run:
sudo systemctl restart httpdOn Debian/Ubuntu, run:
sudo systemctl restart apache2 5. To check, if everything is configured correctly, run (replace 198.51.100.255 with your Zabbix server IP address):
curl 198.51.100.255/server-statusThe response should contain Apache web server statistics.
Configure Zabbix for monitoring
1. Log into Zabbix frontend.
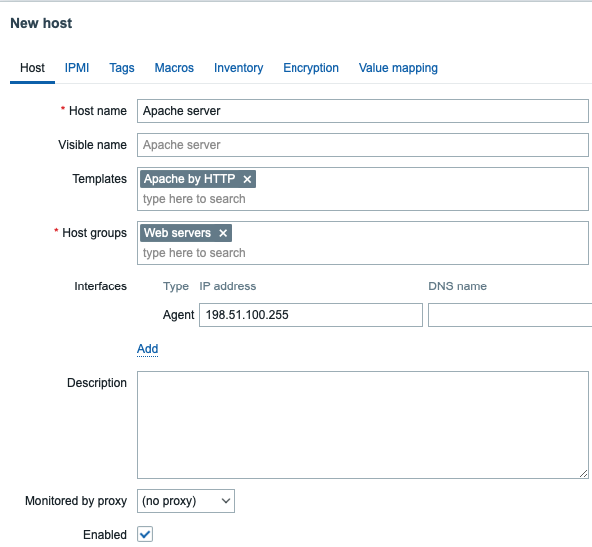
2. Create a host in Zabbix web interface.
This host will represent your Apache server.
3. In the Interfaces parameter, add Agent interface and specify your Apache instance IP address. You don't need to install Zabbix agent on the machine, the interface will only be used for resolving {HOST.CONN} macro. This macro is used in template items to locate Apache instance.
4. In the Templates parameter, type or select Apache by HTTP.
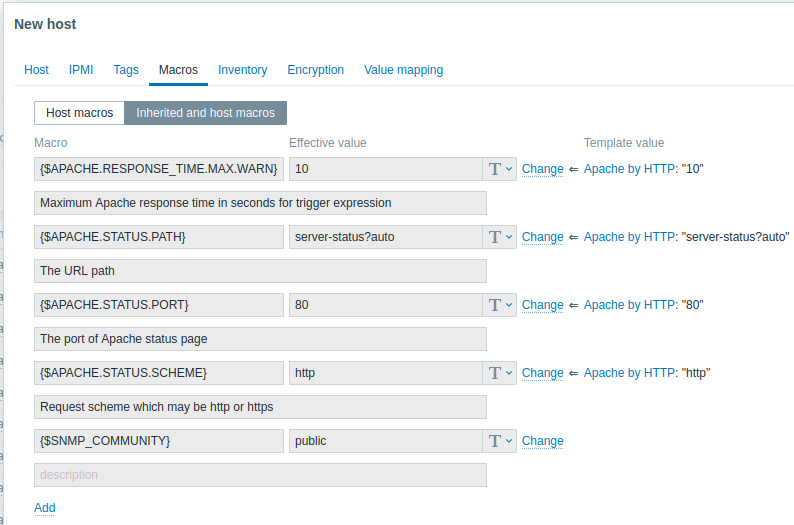
5. Switch to the Macros tab and select Inherited and host macros mode. Check that values of the macros {$APACHE.STATUS.PORT} and {$APACHE.STATUS.SCHEME} suit your installation settings. By default, the port is 80 and the scheme is http. Change macro values if you use different port and/or scheme.
View collected metrics
Congratulations! At this point, Zabbix is already monitoring your Apache web server.
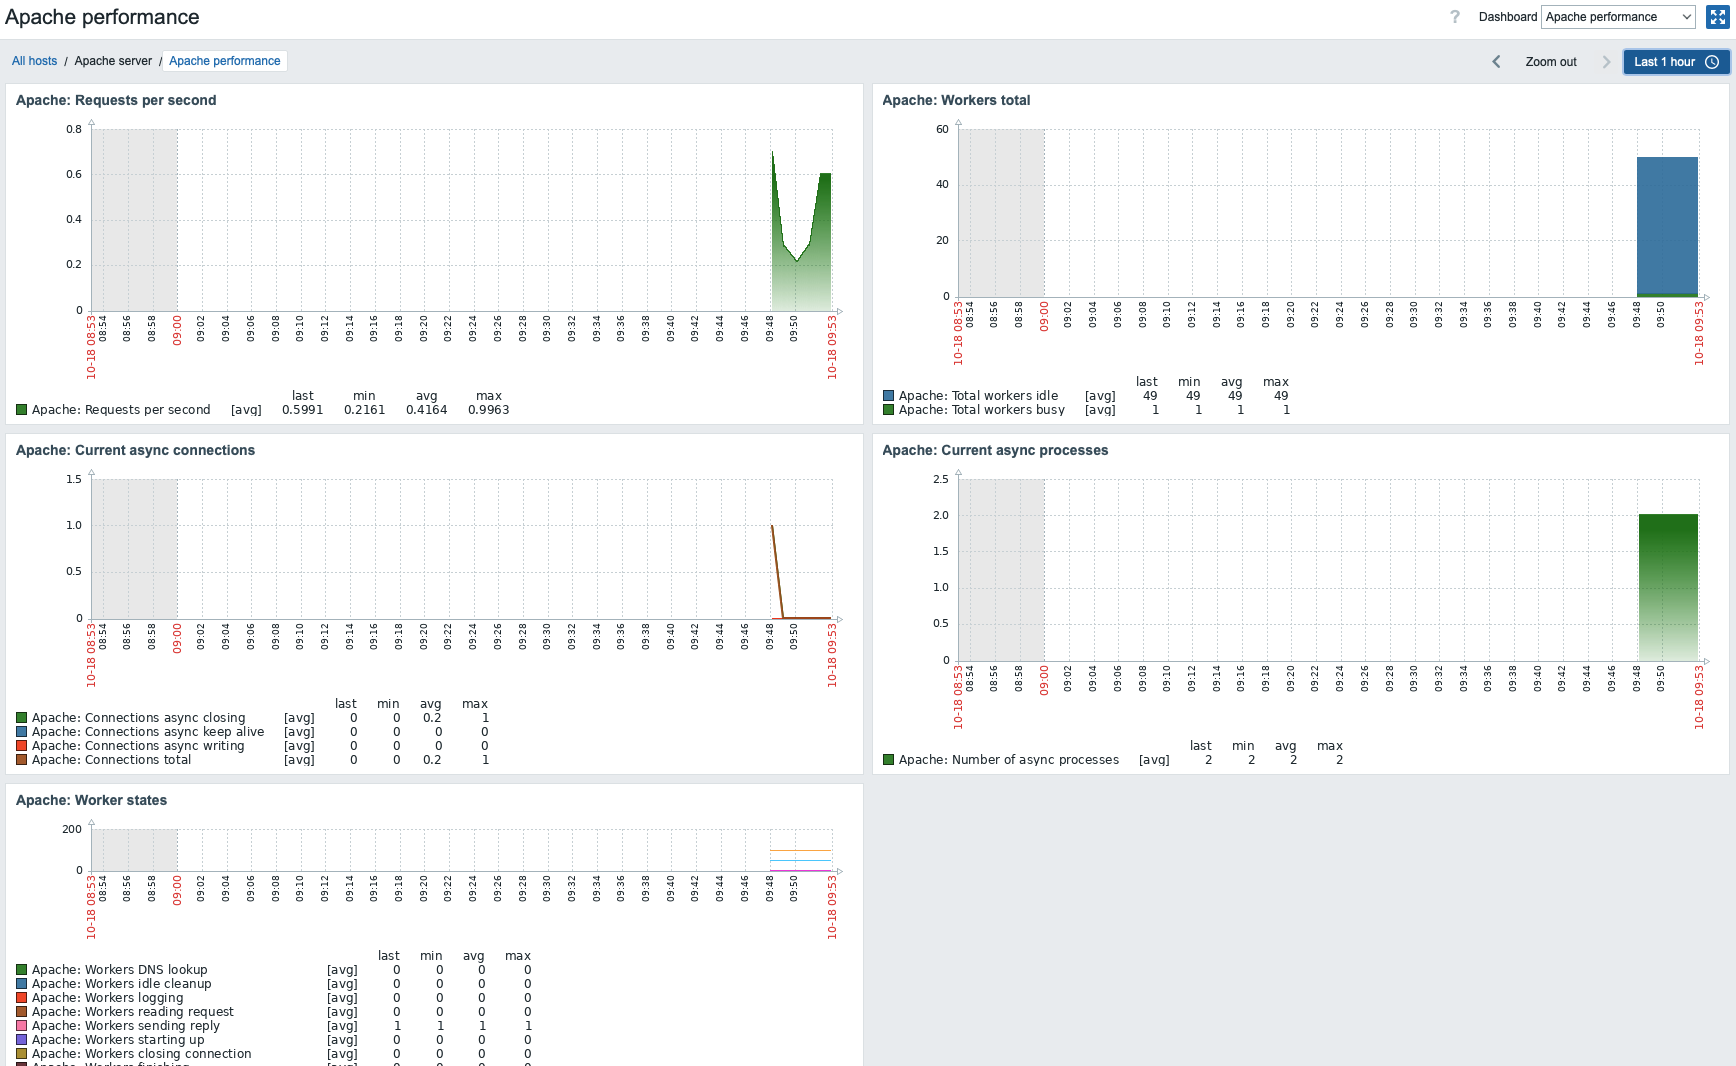
To view collected metrics, open the Monitoring->Hosts menu section and click on the Dashboards next to the host.

This action will take you to the host dashboard with most important metrics collected from Apache /server-status page.
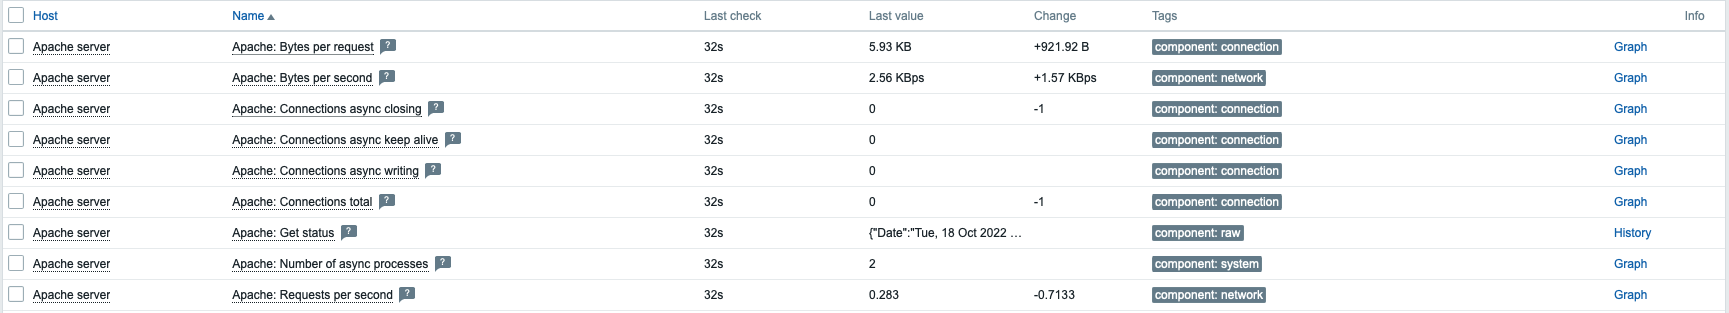
Alternatively, from the Monitoring->Hosts, you can click on the Latest data to view all the latest collected metrics in a list.
Set up problem alerts
Zabbix can notify you about a problem with your infrastructure using a variety of methods. This guide provides configuration steps for sending email alerts.
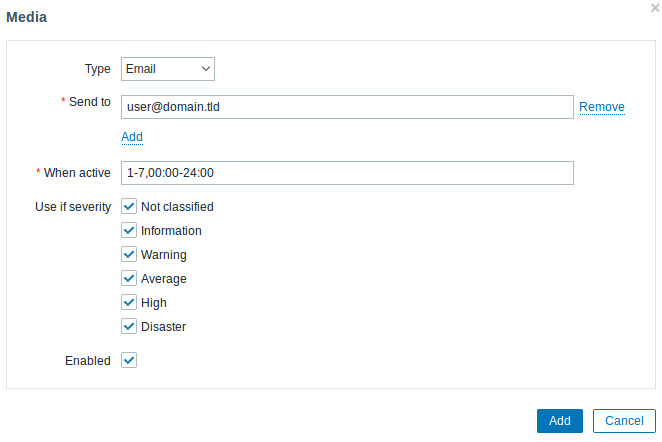
1. Go to the User settings -> Profile, switch to the tab Media and add your email.
2. Follow the guide for Receiving problem notification.
Next time, when Zabbix detects a problem you should receive an alert via email.
Test your configuration
To simulate real problem and receive a test problem alert:
1. Open the Apache server host configuration in Zabbix.
2. Switch to the Macros tab and select Inherited and host macros.
3. Press Change next to {$APACHE.STATUS.PORT} macro and set a different port.
4. Press Update to save host configuration.
5. In a few minutes, Zabbix will detect the problem Apache service is down, because now it cannot connect to the instance. It will appear in the Monitoring->Problems section.

If the alerts are configured, you will also receive the problem notification.
6. Change the macro value back to resolve the problem and continue monitoring Apache.
See also:
- Web server hardening - recommended settings for greater web server security.
- Creating an item - how to start monitoring additional metrics.
- HTTP items - how to monitor custom metrics using HTTP agent.
- Problem escalations - how to create multi-step alert scenarios (e.g., first send message to the system administrator, then, if a problem is not resolved in 45 minutes, send message to the data center manager).