3 Setup example
Overview
This section describes a simple setup for monitoring Zabbix high availability cluster as a service.
Pre-requisites
Prior to configuring service monitoring, you need to have the hosts configured:
- HA node 1 with at least one trigger and a tag (preferably set on a trigger level)
component:HA node 1 - HA node 2 with at least one trigger and a tag (preferably set on a trigger level)
component:HA node 2
Service tree
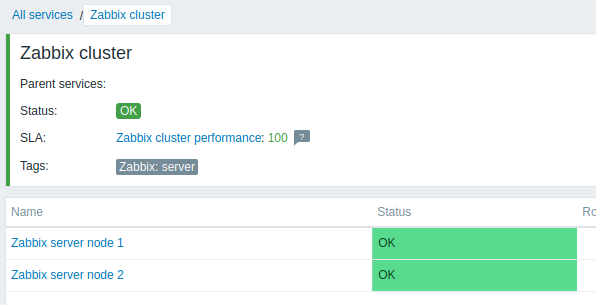
The next step is to build the service tree. In this example, the infrastructure is very basic and consists of three services: Zabbix cluster (parent) and two child services Zabbix server node 1 and Zabbix server node 2.
Zabbix cluster
|
|- Zabbix server node 1
|- Zabbix server node 2
At the Services page, turn on Edit mode and press Create service:
In the service configuration window, enter name Zabbix cluster and mark the checkbox Advanced configuration.
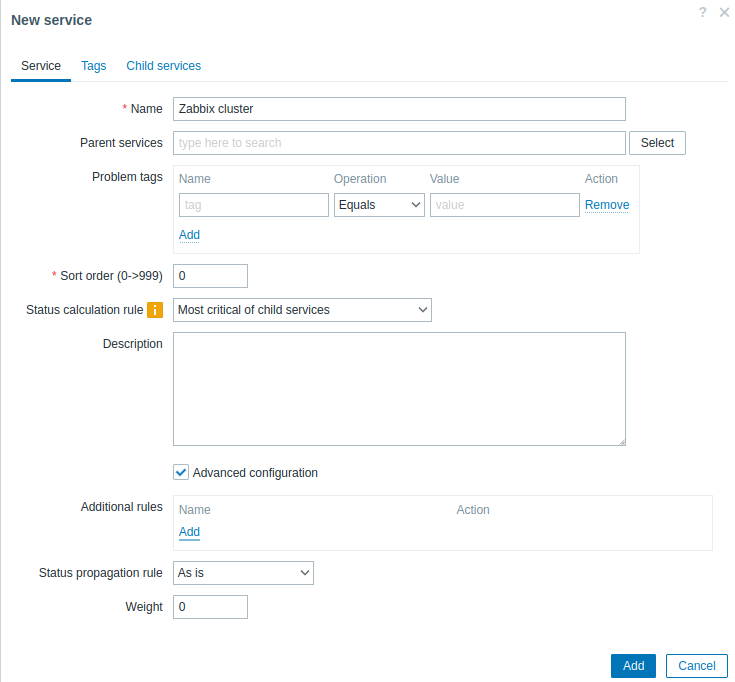
Configure additional rule:
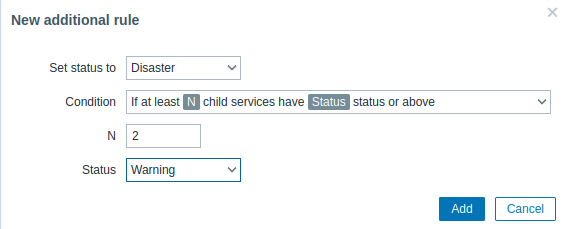
Zabbix cluster will have two child services - one for each of the HA nodes. If both HA nodes have problems of at least Warning status, parent service status should be set to Disaster. To achieve this, additional rule should be configured as:
- Set status to: Disaster
- Condition: If at least
Nchild services haveStatusstatus or above - N: 2
- Status: Warning
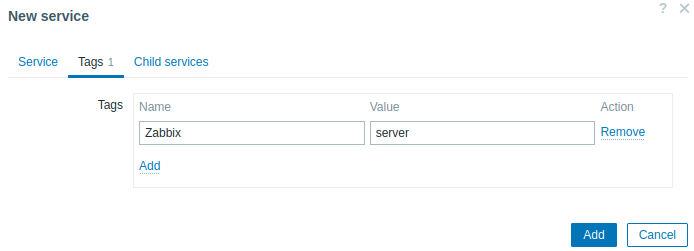
Switch to the Tags tab and add a tag Zabbix:server. This tag will be used later for service actions and SLA reports.
Save the new service.
To add a child service, press on the plus icon next to the Zabbix cluster service (the icon is visible only in Edit mode).

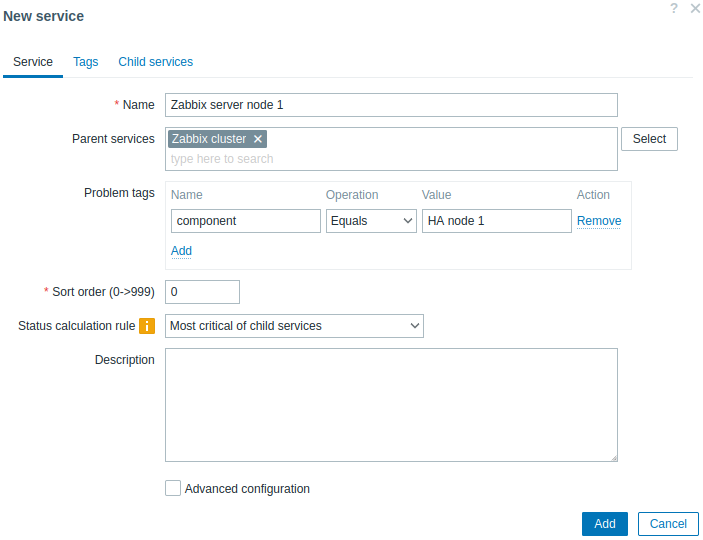
In the service configuration window, enter name Zabbix server node 1. Note that the Parent services parameter is already pre-filled with Zabbix cluster.
Availability of this service is affected by problems on the host HA node 1, marked with component:HA node 1 problem tag. In the Problem tags parameter, enter:
- Name: component
- Operation: Equals
- Value: HA node 1
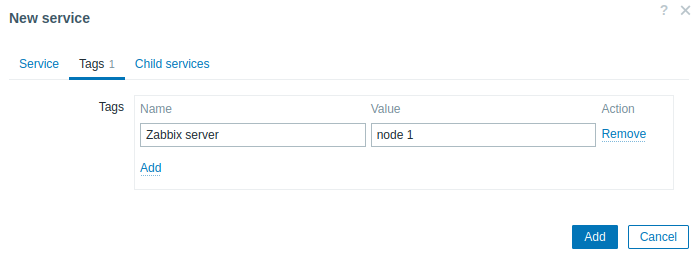
Switch to the Tags tab and add a service tag: Zabbix server:node 1. This tag will be used later for service actions and SLA reports.
Save the new service.
Create another child service of Zabbix cluster with name "Zabbix server node 2".
Set the Problem tags as:
- Name: component
- Operation: Equals
- Value: HA node 2
Switch to the Tags tab and add a service tag: Zabbix server:node 2.
Save the new service.
SLA
In this example, expected Zabbix cluster performance is 100% excluding semi-annual one hour maintenance period.
First, you need to add a new service level agreement.
Go to the Services->SLA menu section and press Create SLA. Enter name Zabbix cluster performance and set the SLO to 100%.
The service Zabbix cluster has a service tag Zabbix:server. To use this SLA for measuring performance of Zabbix cluster, in the Service tags parameter, specify:
- Name: Zabbix
- Operation: Equals
- Value: server
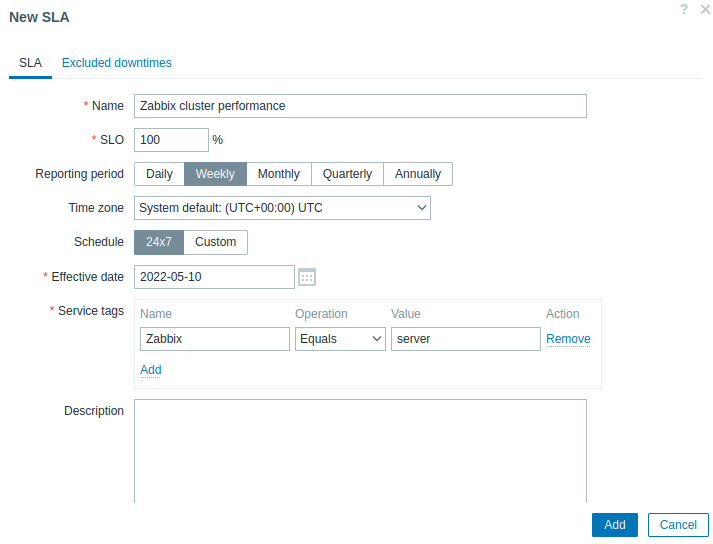
In a real-life setup, you can also update desired reporting period, time zone and start date or change the schedule from 24/7 to custom. For this example, the default settings are sufficient.
Switch to the Excluded downtimes tab and add downtimes for scheduled maintenance periods to exclude these periods from SLA calculation. In the Excluded downtimes section press the Add link, enter downtime name, planned start time and duration.
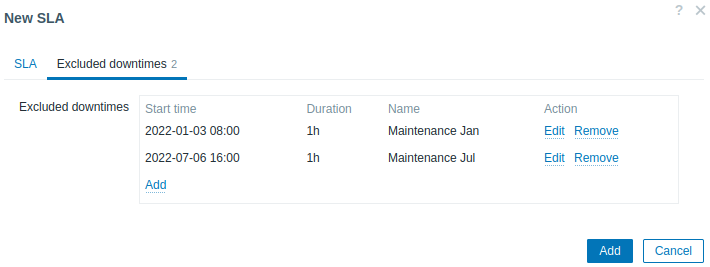
Press Add to save the new SLA.
Switch to the SLA reports section to view the SLA report for Zabbix cluster.

The SLA info can also be checked in the Services section.