
- 5 What's new in Zabbix 6.4.0
- Menu layout
- Cause and symptom problems
- Streaming to external systems
- LDAP/SAML user provisioning
- Automation for Gmail/Office365 media types
- Optimized SNMP discovery and collection
- Notification macros in alert scripts
- Interface not required for some checks
- Runtime commands for profiling
- Date removed from export
- Host and template import
- Action log export to CSV
- Higher limit for host metadata
- Security
- Items
- Templates
- Performance
- Frontend
5 What's new in Zabbix 6.4.0
See breaking changes for this version.
Menu layout
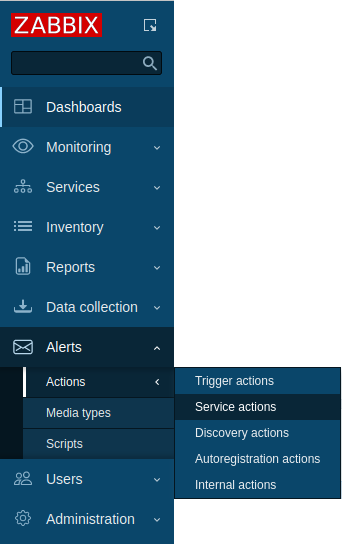
The new version features an updated menu layout, which includes the following changes:
- Dashboards now are a top-level menu entry (previously Dashboard under the Monitoring menu).
- A new Alerts top-level menu has been added, which contains submenus related to alerting such as Actions, Media types and Scripts.
- Actions has a submenu with all types of actions (including Service actions, previously under Services).
- A new Users top-level menu has been added, which contains submenus related to user management such as User groups, User roles, Users, API tokens and Authentication.
- A new Data collection menu replaces the previous Configuration menu and contains subsections that are related to configuring data collection (with actions moved to Alerts).
In other changes:
- The Audit section has been renamed to Audit log under Reports.
- The Administration menu no longer contains submenus related to alerting and user management.
Also:
- Housekeeping, Macros and Audit log that previously were submenus of Administration -> General have been moved one level up and now are submenus of Administration.
The new menu in full can be seen in frontend sections.
Note that access to the new menu depends on the user type and defined user role (see Permissions for more details).
Cause and symptom problems
The new version comes with an option to mark problems as cause or symptom problems.
For example, power outage may be the actual root cause why some host is unreachable or some service is down. In this case, the "host is unreachable" and "service is down" problems may be classified as the symptom problems of "power outage" - the cause problem.
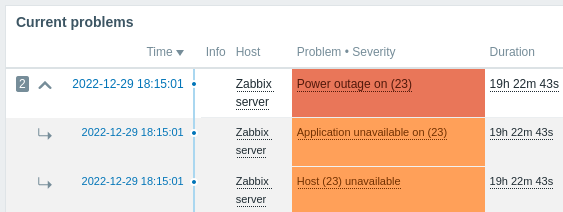
Symptom problems are grouped under the cause problem and marked accordingly, with an icon, smaller font and different background. The cause problem has a number showing how many symptoms are attributed to it.
By default all new problems are classified as cause problems. It is possible, in Monitoring -> Problems, to manually reclassify certain problems as symptom problems of the cause problem.
It is also possible to revert a symptom problem back to a cause problem.
New {EVENT.CAUSE.*} macros allow to reference the cause event in the symptom event notifications, while {EVENT.SYMPTOMS} allows to retrieve a list of symptoms in the cause event messages.
See also: Cause and symptom problems.
Streaming to external systems
It is now possible to stream item values and events from Zabbix to external systems over HTTP (see protocol details). The tag filter can be used to stream subsets of item values or events.
This feature currently has experimental status.
The following steps are required to configure data streaming to an external system:
- Have a remote system set up for receiving data from Zabbix (see the documentation of a simple receiver).
- Set the required number of connector workers in Zabbix (see StartConnectors in zabbix_server.conf). Restart the Zabbix server.
- Configure a new connector in Zabbix (Administration -> General -> Connectors) with the receiver URL and other parameters.
When the connector has been saved, Zabbix will start sending data to the data receiver.
See also: Streaming to external systems
In this development, two new processes have been added to Zabbix server: connector manager and connector worker.
A new Zabbix internal item zabbix[connector_queue] allows to monitor the count of values enqueued in the connector queue.
LDAP/SAML user provisioning
It is now possible to configure JIT (just-in-time) user provisioning for LDAP/SAML users. In this case, it is not required that a user already exists in Zabbix. The user account can be created when the user logs into Zabbix for the first time.
In addition to automatic user creation and updating the new functionality also allows to specify user group and user media matching between LDAP/SAML and Zabbix.
Provisioned users will be marked in the user list by a date entry in a new Provisioned column. Also, a Provision now option has been added to the user list to update users created from LDAP.
See also:
Automation for Gmail/Office365 media types
Gmail or Office365 users may now benefit from easier media type configuration. The new Email provider field in the mail media type configuration allows to select pre-configured options for Gmail and Office 365 (alongside the "Generic SMTP" option, which works as before).

When selecting the Gmail/Office365 related options, it is only required to supply the sender email address/password to create a working media type.

If the email address/password is supplied, Zabbix is able to automatically fill all required settings for Gmail/Office365 media types with the actual/recommended values, i.e. SMTP server, SMTP server port, SMTP helo, and Connection security. Because of this automation, these fields are not even shown, however, it is possible to see the SMTP server and email details in the media type list (see the Details column).
Note also that:
- The password is not required for the relay options.
- For Office365 relay, the domain name of the provided email address will be used to dynamically fill the SMTP server
(i.e. replace "example.com" in
example-com.mail.protection.outlook.comwith the real value). - The SMTP helo value is the domain name extracted from the provided email address.
In other changes:
- The SMTP email field is now called simply Email.
- The SMTP helo field is now optional (if empty, it will send the domain part of the sender email).
- New default media types have been added: Gmail, Gmail relay, Office365, Office365 relay.
- In new installations, all media types are disabled by default.
- In user media, where specific recipient addresses are specified, only enabled media types can be selected.
- In user media, there is now a yellow icon and status column shown indicating if the media type has been disabled.
See also:
Optimized SNMP discovery and collection
SNMP discovery and data collection has been updated to use native SNMP bulk requests (GetBulkRequest-PDUs), available in SNMP versions 2/3.
A GetBulk request in SNMP executes multiple GetNext requests and returns the result in a single response.
Previously, only the SNMP discovery[] item in Zabbix would use GetBulk requests;
it was not available for regular SNMP items and also discovered SNMP items would have to query the devices independently.
Using the new SNMP walk[OID1,OID2,...] item, it becomes possible to collect data in one request and parse the response as needed, without additional requests to devices. For example,
walk[1.3.6.1.2.1.2.2.1.2,1.3.6.1.2.1.2.2.1.3]returns a multi-line list of interface names and types.
Using the Zabbix preprocessing options, the response of this item may be used to discover interfaces, create discovered items and populate their values.
Note that the discovery rule in this case must be a dependent discovery rule to the walk[] master item
and item prototypes must be dependent item prototypes of the walk[] master item.
To make this functionality possible, two new preprocessing steps have been added:
- SNMP walk value - extract and format SNMP walk value by the specified OID/MIB name;
- SNMP walk to JSON - convert SNMP walk values to JSON. This step may be used in low-level discovery of SNMP OIDs.
The walk[] item returns the output of the snmpwalk utility with -Oe -Ot -On parameters.
MIB names are supported as parameters; thus walk[1.3.6.1.2.1.2.2.1.2] and walk[ifDescr] will return the same output.
If several OIDs/MIBs are specified, i.e. walk[ifDescr,ifType,ifPhysAddress], then the output is a concatenated list.
This item uses GetBulk requests with SNMPv2 and v3 interfaces and GetNext for SNMPv1 interfaces; the max repetition value for GetBulk requests is configured on the SNMP interface level.
The previous "use bulk requests" option in Zabbix has been retained (under a new name "use combined requests"). This is not related to native SNMP bulk requests in any way; it is Zabbix own way of combining multiple SNMP requests.
See also:
Notification macros in alert scripts
Alert script parameters now support user macros and all built-in macros that are supported in Zabbix notifications (including in trigger-based, autoregistration, discovery, internal, and service notifications) in addition to the {ALERT.*} macros supported previously.
Alert script testing form has been updated to allow specifying custom parameter values for the test procedure.
Interface not required for some checks
It is no longer required to define an interface when creating items of the following type:
- Simple check
- External check
- SSH agent
- Telnet agent
The interface field for these items is no longer mandatory. Also, it is now possible to select a "None" option in the interface field.
Runtime commands for profiling
Runtime commands for profiling have been added to Zabbix server and Zabbix proxy.
prof_enable- enable profilingprof_disable- disable profiling
Profiling can be enabled per server/proxy process. Enabled profiling provides details of all rwlocks/mutexes by function name.
See also:
Date removed from export
When exporting objects (hosts, templates, etc.), note that the element date is removed from the export format.
Host and template import
The configuration import form for templates/hosts has a new row for All entities in the import rules section.
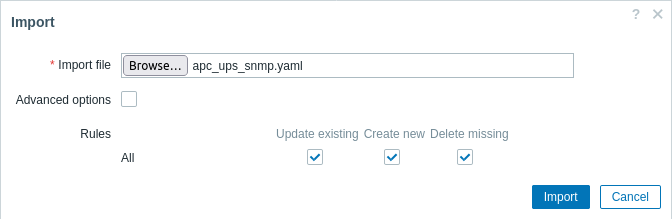
If you mark the checkbox in the All row, all importable entities become marked/unmarked.
To see the full list of entities in the import rules, it is now required to mark the Advanced options checkbox. In another change, the Delete missing option is now checked by default.
Action log export to CSV
It is now possible to export action log records to a CSV file. For more information, see Action log.
Higher limit for host metadata
The HostMetadataItem parameter in agent configuration, used in host autoregistration, now can return up to 65535 UTF-8 code points (instead of 255 in previous versions). A longer value will be truncated.
Note that on MySQL, the effective maximum length in characters will be less if the returned value contains multibyte characters. For example, a value containing 3-byte characters only will be limited to 21844 characters in total, while a value containing 4-byte characters only will be limited to 16383 symbols.
Also, the maximum length of the HostMetadata option in agent configuration has been increased to 2034 bytes.
Security
Secure password change
When changing your user password in User profile or User configuration (for users with the Super admin role), Zabbix now asks and verifies the current (old) password to allow changing it. On a successful password change, the user will be logged out of all active sessions. Note that the password can only be changed for users using Zabbix internal authentication.
CSRF tokens
For enhanced security against CSRF (Cross Site Request Forgery) attacks, Zabbix frontend now uses randomly generated CSRF tokens instead of static session-based tokens.
Items
New and updated agent items
New items have been added to Zabbix agent/agent 2:
- system.sw.packages.get - return information about installed packages in JSON format.
In comparison to the existing
system.sw.packagesitem, the new item returns more details. - system.sw.os.get - return information about the operating system, such as version, type, distribution name, build number, minor and major version, etc., in JSON format.
The following Zabbix agent/agent 2 items have been updated:
- system.sw.os that returns OS information as a string is now also supported on Windows.
- vfs.fs.get and vfs.fs.discovery, used for discovery of mounted filesystems, now additionally return filesystem mount options in the "options" and "{#FSOPTIONS}" property respectively. These options allow to detect filesystems that remounted as read-only (e.g. on VMs) or to filter bind mounts or .dmg volumes on macOS.
See also:
- Zabbix agent items for detailed item description.
- Template changes for details how item-related changes are reflected in the existing templates.
Additional ssh.run options
The item ssh.run[] has been updated and now allows to pass additional SSH options as part of the item key. See SSH checks for details.
Templates
Template versioning
To improve management and upgrade of templates, template versioning has been introduced.
In Data collection → Templates you can now see the template vendor and version, as well as filter templates by vendor and/or version.
For more information, see Upgrade notes for 6.4.0.
Updated templates
The following templates have been updated:
- Templates that discover filesystems (updated to make use of the
vfs.fs.getitem instead ofvfs.fs.discoveryitem with some additional changes); - Linux by Zabbix agent (
system.sw.packagesitem replaced bysystem.sw.packages.getitem; new trigger); - Windows by Zabbix agent, Windows by Zabbix agent active (included
system.sw.ositem; new trigger).
For more information about the updates, see Template changes.
You can get these templates:
- In Data collection → Templates in new installations;
- If you are upgrading from previous versions, you can download new templates from Zabbix Git repository or find them in the zabbix/templates directory of the downloaded latest Zabbix version. Then, while in Data collection → Templates, you can import them manually into Zabbix.
Performance
Instant refresh of active checks
Previously Zabbix agent (in active mode) received from Zabbix server or Zabbix proxy a full copy of the configuration once every two minutes (default). By introducing incremental configuration sync, full configuration is no longer sent if there are no changes to host or global regular expressions, thus default sync interval has been reduced to 5 seconds.
'RefreshActiveChecks' parameter supported in a Zabbix agent configuration file default value is changed to 5 seconds (previously 120).
JSON protocol for active agent checks has been updated to include config_revision and session ID.
For more information, see Passive and active agent checks.
Thread-based preprocessing workers
The item value preprocessing has been rewritten to use thread-based preprocessing workers for enhanced parallelism and reduced overhead. This development should help avoid situations when the prolonged preprocessing of one item holds up others.
This change adds a new required library for Zabbix server/proxy - libevent_pthreads.
See also: Preprocessing details
Value cache optimization
Previously the value cache was optimized for working with frequently changing data. Values for items that were updated less than daily were removed from the value cache.
Now the value cache is optimized for a wider variety of monitoring patterns. Item values remain in the value cache until the item is deleted or until the item value is outside the time or count range specified in the trigger/calculated item expression.
For more information, see Value cache.
Optimized proxy configuration update
In previous Zabbix versions the server would send a full copy of the configuration to the proxy every time the configuration is synced.
Now it has been replaced with an incremental update of the proxy configuration. During a configuration sync only the modified entities are updated (thus, if no entities have been modified, nothing will be sent). This approach allows to save resources and set a smaller interval (down to almost instant) for the proxy configuration update.
For more details, see Synchronization of monitoring configuration.
Configuration parameters
The ProxyConfigFrequency parameter determines how often the proxy configuration is synced with the server (now 10 seconds by default).
Note that ProxyConfigFrequency is:
- the server parameter for passive proxies;
- the proxy parameter for active proxies.
On active proxies ProxyConfigFrequency is a new parameter and must be used instead of the now-deprecated ConfigFrequency.
If both ProxyConfigFrequency and ConfigFrequency are used, the proxy will log an error and terminate.
Also, the default value of CacheUpdateFrequency on the server has been lowered from 60 to 10 seconds.
Zabbix server support for older proxies
In a server-proxy setup, the upgrade procedure has become more flexible. Now, Zabbix server officially supports data collection, execution of remote commands, and immediate item value checks by outdated proxies that are no older than Zabbix server previous LTS release version. Older proxies are not supported, and all communication with Zabbix server will fail with a warning. For more information, see Upgrade procedure.
Automated database upgrade on proxies with SQLite
Upon the first launch after an upgrade, Zabbix proxy with SQLite3 now automatically dumps the existing older version of the database file and creates a new one for the current version. History data that has been stored in the SQLite database file is not preserved. Previously, the SQLite database file had to be recreated manually.
Heartbeat dropped from Zabbix proxy
The heartbeat sender has been removed from the proxy. Therefore, Zabbix proxy item zabbix [process,heartbeat sender] is no longer supported and has been removed from templates. The HeartbeatFrequency parameter has been deprecated.
Frontend
Context menu
Context menus for items, hosts, and events have become more functional.
New options
-
Host context menu now offers options to navigate to the lists of host items, triggers, discovery rules, or web scenarios to quickly access configuration of the required entity.
-
Item context menu now offers options to:
- see all triggers based on an item and navigate to the configuration of any of them;
- create a new trigger, a dependent item, or a discovery rule based on the item;
- switch to the Latest data section filtered by the current host and item.
-
Event context menu now offers options to:
- acknowledge or update a problem;
- see all items used by a problem trigger and navigate to the configuration of any of them;
- mark problems as symptom or cause.
Note that links to the configuration section are only visible to Admin and Super admin level users with sufficient permissions.
Custom links
Host context menu and event context menu can be customized further by adding custom links. In the Alerts → Scripts menu section, it is now possible to add a global script of the new type URL. If configured, such links will be visible in the context menu of matching hosts/problem events.
Configurable trigger URL label
When configuring a trigger, it is now possible to add a custom label to a trigger URL. If configured, the custom label will be displayed instead of the default label (Trigger URL) in the event context menu.
A new {TRIGGER.URL.NAME} macro for trigger URL labels has been introduced. This macro is supported in all places currently supported by the existing macro {TRIGGER.URL}.
Additional item menu location
Item context menu is now also available in:
- Data collection → Hosts → Items
- Data collection → Hosts → Discovery rules → Item prototypes
Dashboard widgets
Dynamic background color for Item value widget
The Item value widget now allows to configure a dynamic background color based on the thresholds set and the latest received value.
Usability updates for Graph widget
When configuring a Graph widget, it is now possible to rename data sets by customizing the Data set label. This makes it easier to identify data sets in widget configuration, as well as identify aggregated data sets in graph Legend.
Autocomplete functionality of the widget has also been improved. The Item pattern field suggestions now only display the items that belong to the hosts selected in the Host pattern field.
Decimal places for item values in Top hosts widget
When configuring columns of data type "Item value" in the Top hosts widget, it is now possible to specify how many decimal places will be displayed with the value.
Dynamic item field renamed
The field that enables dynamic widgets has been renamed from Dynamic item to Enable host selection for more clarity.
Ack link renamed to update
The link from the problem list to the problem update screen has been renamed from Ack (Acknowledge) to Update to correctly reflect multiple options that are available in the problem update screen in recent versions (not only acknowledgment).
The respective Ack (Acknowledgment) column in the problem list has also been renamed to Update.
When a problem has been acknowledged it is no longer displayed by the link color in the acknowledgment column;
it is now displayed by a green checkbox ![]() icon in the Actions column.
icon in the Actions column.
Host filtering by status
Hosts displayed in the Data collection → Hosts section can now be filtered by status (enabled/disabled).
New action log filtering options
New filtering options have been added to Reports → Action log section. In addition to filtering records by notification recipients, now you can also filter records by actions, media types, status, or by the message/remote command content. These filtering options can also be configured for the Action log widget.
Frontend languages
Catalan language is now enabled in the frontend.
Modal forms
The forms for action configuration, maintenance period configuration, as well as the form for copying items, triggers and graphs between hosts or templates are now opened in a modal (pop-up) window.