
On this page
17 Problems
Overview
In this widget you can display current problems. The information in this widget is similar to Monitoring → Problems.
Configuration
To configure, select Problems as type:

You can limit how many problems are displayed in the widget in various ways - by problem status, problem name, severity, host group, host, event tag, acknowledgment status, etc.
In addition to the parameters that are common for all widgets, you may set the following specific options:
| Show | Filter by problem status: Recent problems - unresolved and recently resolved problems are displayed (default) Problems - unresolved problems are displayed History - history of all events is displayed |
| Host groups | Enter host groups to display problems of in the widget. This field is auto-complete so starting to type the name of a group will offer a dropdown of matching groups. Specifying a parent host group implicitly selects all nested host groups. Problems from these host groups will be displayed in the widget. If no host groups are entered, problems from all host groups will be displayed. |
| Exclude host groups | Enter host groups to hide problems of from the widget. This field is auto-complete so starting to type the name of a group will offer a dropdown of matching groups. Specifying a parent host group implicitly selects all nested host groups. Problems from these host groups will not be displayed in the widget. For example, hosts 001, 002, 003 may be in Group A and hosts 002, 003 in Group B as well. If we select to show Group A and exclude Group B at the same time, only problems from host 001 will be displayed in the widget. |
| Hosts | Enter hosts to display problems of in the widget. This field is auto-complete so starting to type the name of a host will offer a dropdown of matching hosts. If no hosts are entered, problems of all hosts will be displayed. |
| Problem | You can limit the number of problems displayed by their name. If you enter a string here, only those problems whose name contains the entered string will be displayed. Macros are not expanded. |
| Severity | Mark problem severities to filter problems to be displayed in the widget. If no severities are marked, all problems will be displayed. |
| Tags | Specify problem tags to limit the number of problems displayed in the widget. It is possible to include as well as exclude specific tags and tag values. Several conditions can be set. Tag name matching is always case-sensitive. There are several operators available for each condition: Exists - include the specified tag names Equals - include the specified tag names and values (case-sensitive) Contains - include the specified tag names where the tag values contain the entered string (substring match, case-insensitive) Does not exist - exclude the specified tag names Does not equal - exclude the specified tag names and values (case-sensitive) Does not contain - exclude the specified tag names where the tag values contain the entered string (substring match, case-insensitive) There are two calculation types for conditions: And/Or - all conditions must be met, conditions having the same tag name will be grouped by the Or condition Or - enough if one condition is met When filtered, the tags specified here will be displayed first with the problem, unless overridden by the Tag display priority (see below) list. |
| Show tags | Select the number of displayed tags: None - no Tags column in Monitoring → Problems 1 - Tags column contains one tag 2 - Tags column contains two tags 3 - Tags column contains three tags To see all tags for the problem roll your mouse over the three dots icon. |
| Tag name | Select tag name display mode: Full - tag names and values are displayed in full Shortened - tag names are shortened to 3 symbols; tag values are displayed in full None - only tag values are displayed; no names |
| Tag display priority | Enter tag display priority for a problem, as a comma-separated list of tags (for example: Services,Applications,Application). Tag names only should be used, no values. The tags of this list will always be displayed first, overriding the natural ordering by alphabet. |
| Show operational data | Select the mode for displaying operational data: None - no operational data is displayed Separately - operational data is displayed in a separate column With problem name - append operational data to the problem name, using parentheses for the operational data |
| Show symptoms | Mark the checkbox to display in its own line problems classified as symptoms. |
| Show suppressed problems | Mark the checkbox to display problems that would otherwise be suppressed (not shown) because of host maintenance or single problem suppression. |
| Show unacknowledged only | Mark the checkbox to display unacknowledged problems only. |
| Sort entries by | Sort entries by: Time (descending or ascending) Severity (descending or ascending) Problem name (descending or ascending) Host (descending or ascending). |
| Show timeline | Mark the checkbox to display a visual timeline. |
| Show lines | Specify the number of problem lines to display. |
Using the widget
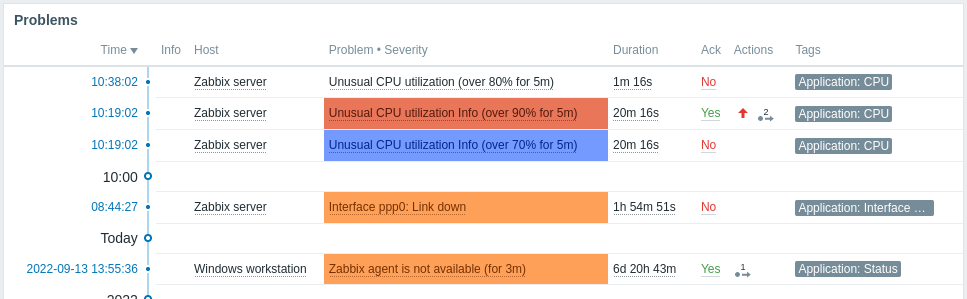
Problems widget offers quick access to additional information:
- Click on the problem date and time to view event details
- If Info column is not empty, you can hover over displayed icon to view additional details
- Click on the host name to open the host menu
- Click on the problem name to open the event menu
- Hover over or click on the problem duration to view problem event popup
- Press on the Yes or No in the Acknowledge (Ack) column to update a problem
- Hover over or press on the gray arrow icon in Actions column to view list of executed actions
Problem event popup
The problem event popup includes the list of problem events for this trigger and, if defined, the trigger description and a clickable URL.
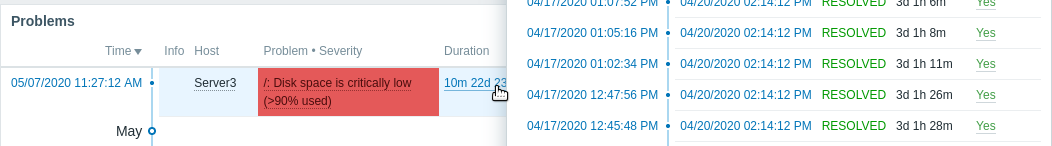
To bring up the problem event popup:
- roll a mouse over the problem duration in the Duration column of the Problems widget. The popup disappears once you remove the mouse from the duration.
- click on the duration in the Duration column of the Problems widget. The popup disappears only if you click on the duration again.