
On this page
18 Problems by severity
Overview
In this widget, you can display the problem count by severity. You can limit what hosts and triggers are displayed in the widget and define how the problem count is displayed.
The problem count is displayed only for cause problems.
Configuration
To configure, select Problems by severity as type:
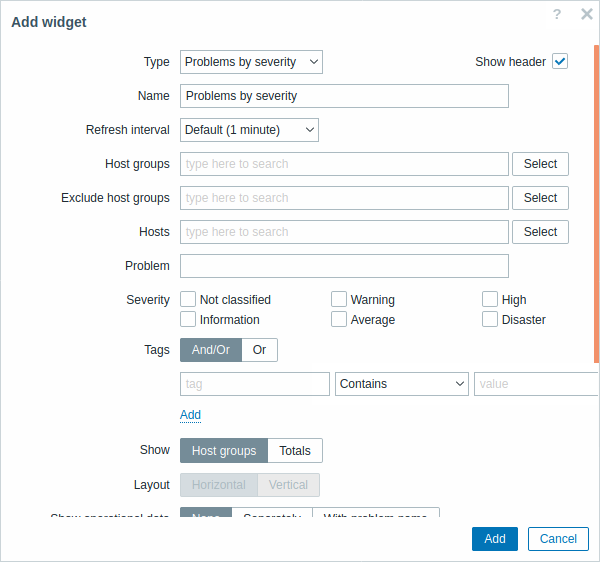
In addition to the parameters that are common for all widgets, you may set the following specific options:
| Host groups | Enter host groups to display in the widget. This field is auto-complete so starting to type the name of a group will offer a dropdown of matching groups. Specifying a parent host group implicitly selects all nested host groups. Host data from these host groups will be displayed in the widget. If no host groups are entered, all host groups will be displayed. |
| Exclude host groups | Enter host groups to hide from the widget. This field is auto-complete so starting to type the name of a group will offer a dropdown of matching groups. Specifying a parent host group implicitly selects all nested host groups. Host data from these host groups will not be displayed in the widget. For example, hosts 001, 002, 003 may be in Group A and hosts 002, 003 in Group B as well. If we select to show Group A and exclude Group B at the same time, only data from host 001 will be displayed in the Dashboard. |
| Hosts | Enter hosts to display in the widget. This field is auto-complete so starting to type the name of a host will offer a dropdown of matching hosts. If no hosts are entered, all hosts will be displayed. |
| Problem | You can limit the number of problem hosts displayed by the problem name. If you enter a string here, only those hosts with problems whose name contains the entered string will be displayed. Macros are not expanded. |
| Severity | Mark problem severities to filter problems to be displayed in the widget. If no severities are marked, all problems will be displayed. |
| Tags | Specify problem tags to limit the number of problems displayed in the widget. It is possible to include as well as exclude specific tags and tag values. Several conditions can be set. Tag name matching is always case-sensitive. There are several operators available for each condition: Exists - include the specified tag names Equals - include the specified tag names and values (case-sensitive) Contains - include the specified tag names where the tag values contain the entered string (substring match, case-insensitive) Does not exist - exclude the specified tag names Does not equal - exclude the specified tag names and values (case-sensitive) Does not contain - exclude the specified tag names where the tag values contain the entered string (substring match, case-insensitive) There are two calculation types for conditions: And/Or - all conditions must be met, conditions having the same tag name will be grouped by the Or condition Or - enough if one condition is met |
| Show | Select the show option: Host groups - display problems per host group Totals - display a problem total for all selected host groups in colored blocks corresponding to the problem severity. |
| Layout | Select the layout option: Horizontal - colored blocks of totals will be displayed horizontally Vertical - colored blocks of totals will be displayed vertically This field is available for editing if 'Totals' is selected as the Show option. |
| Show suppressed problems | Mark the checkbox to display problems that would otherwise be suppressed (not shown) because of host maintenance. |
| Hide groups without problems | Mark the Hide groups without problems option to hide data from host groups without problems in the widget. |
| Show operational data | Mark the checkbox to display operational data (see description of Operational data in Monitoring → Problems). |
| Problem display | Display problem count as: All - full problem count will be displayed Separated - unacknowledged problem count will be displayed separated as a number of the total problem count Unacknowledged only - only the unacknowledged problem count will be displayed. |
| Show timeline | Mark the checkbox to display a visual timeline. |