
24 Web monitoring
Overview
This widget displays a status summary of the active web monitoring scenarios. See the Web monitoring widget section for detailed information.
Configuration
In cases when a user does not have permission to access certain widget elements, that element's name will appear as Inaccessible during the widget's configuration. This results in Inaccessible Item, Inaccessible Host, Inaccessible Group, Inaccessible Map, and Inaccessible Graph appearing instead of the "real" name of the element.
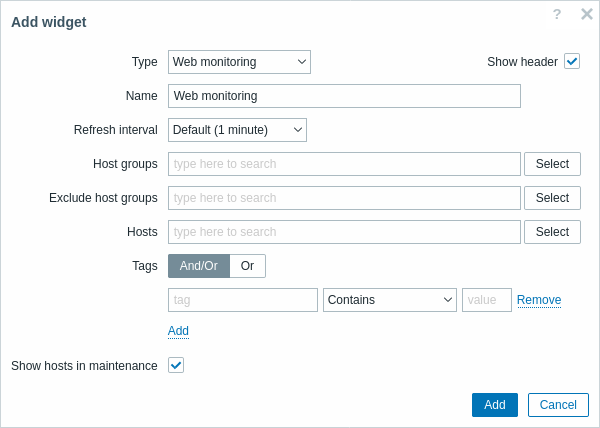
In addition to the parameters that are common for all widgets, you may set the following specific options:
| Host groups | Enter host groups to display in the widget. This field is auto-complete so starting to type the name of a group will offer a dropdown of matching groups. Specifying a parent host group implicitly selects all nested host groups. Host data from these host groups will be displayed in the widget. If no host groups are entered, all host groups will be displayed. |
| Exclude host groups | Enter host groups to hide from the widget. This field is auto-complete so starting to type the name of a group will offer a dropdown of matching groups. Specifying a parent host group implicitly selects all nested host groups. Host data from these host groups will not be displayed in the widget. For example, hosts 001, 002, 003 may be in Group A and hosts 002, 003 in Group B as well. If we select to show Group A and exclude Group B at the same time, only data from host 001 will be displayed in the Dashboard. |
| Hosts | Enter hosts to display in the widget. This field is auto-complete so starting to type the name of a host will offer a dropdown of matching hosts. If no hosts are entered, all hosts will be displayed. |
| Tags | Specify tags to limit the number of web scenarios displayed in the widget. It is possible to include as well as exclude specific tags and tag values. Several conditions can be set. Tag name matching is always case-sensitive. There are several operators available for each condition: Exists - include the specified tag names Equals - include the specified tag names and values (case-sensitive) Contains - include the specified tag names where the tag values contain the entered string (substring match, case-insensitive) Does not exist - exclude the specified tag names Does not equal - exclude the specified tag names and values (case-sensitive) Does not contain - exclude the specified tag names where the tag values contain the entered string (substring match, case-insensitive) There are two calculation types for conditions: And/Or - all conditions must be met, conditions having the same tag name will be grouped by the Or condition Or - enough if one condition is met |
| Show hosts in maintenance | Include hosts that are in maintenance in the statistics. |
Web monitoring widget
Once you have completed the configuration, you might like to see the widget with the data it displays. To do it, go to Dashboards, click on the name of a dashboard where you created the widget.
In this example, you can see the widget named "Zabbix frontend" displaying the status of the web monitoring for three host groups: "Internal network," "Linux servers," and "Web servers."
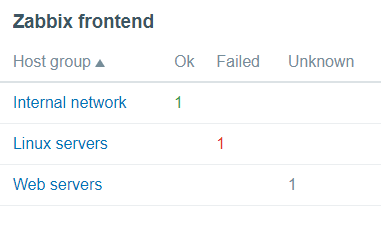
A web monitoring widget displays the following information:
- a name of a widget; below it, there are four columns:
- Host group - displays a list of host groups that contain hosts having web scenarios configured;
- Ok - displays a number of web scenarios (in green color) when two conditions are observed:
- Zabbix has collected the latest data for a web scenario(s);
- all steps that were configured in a web scenario are in "Ok" Status.
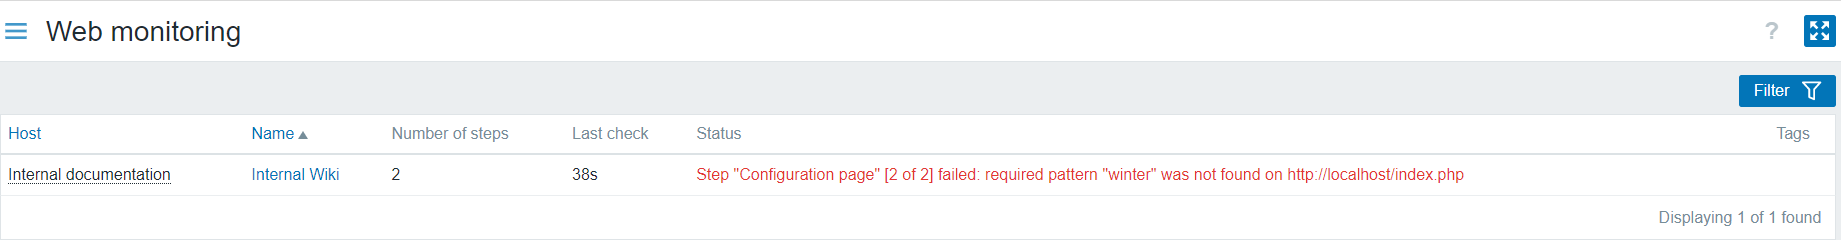
- Failed - displays a number of web scenarios (in red color), which have some failed steps:
- click on the host name, and it will open a new window; the Status column provides detailed information (in red color) on the step where Zabbix failed to collect the data; and also,
- gives a hint for the parameter that has to be corrected in the configuration form.
- Unknown - displays a number of web scenarios (in grey color) for which Zabbix has neither collected data, nor has an information about the failed steps.
Viewing the status and data
Clickable links in the widget allow to easily navigate and quickly acquire a full information on each web scenario. Thus, to view:
- the Status of a web scenario, click on the name of a host group.
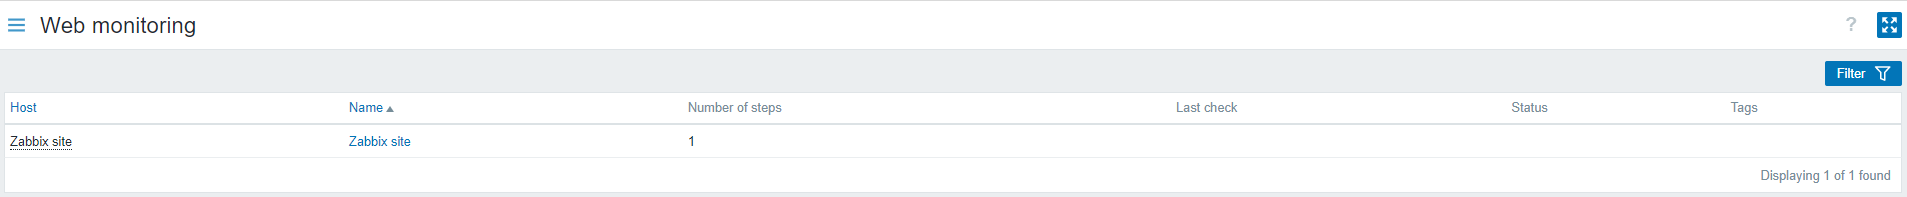
- more detailed statistics, click on the scenario name. In this example it is "Zabbix frontend".
- the details in the case of Failed status, click on a host group name; in the window that opens, click on a web scenario name in the Name column; it will open more detailed information on the configured steps for which Zabbix failed to collect the data.
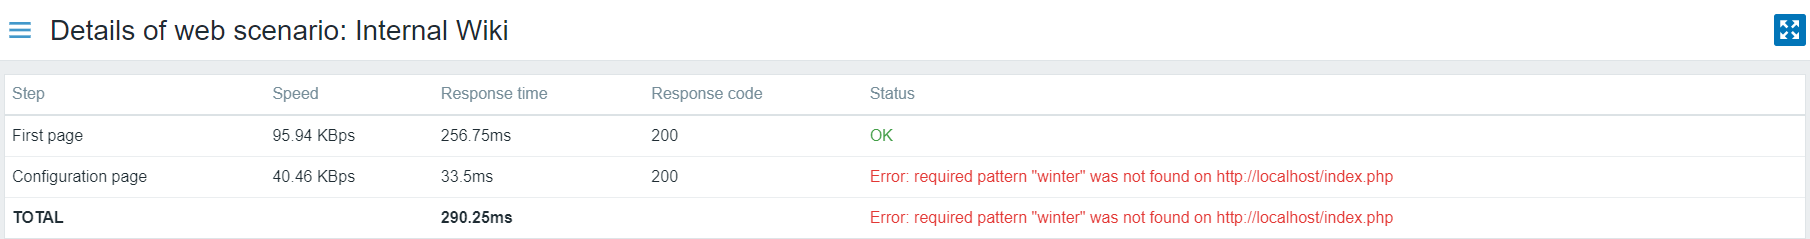
Now, you can return to the web scenario configuration form and correct your settings.
To view the details in the case of Unknown status, you can repeat the same steps as explained for Failed.
At the first monitoring instance, a web scenario is always displayed in Unknown state, which is switched to Failed or Ok state right after the first check. In the case when a host is monitored by the proxy, the status change occurs in accordance with the data collection frequency configured on the proxy.