
1 General
Overview
The Administration → General section contains a number of subsections for setting frontend-related defaults and customizing Zabbix.
The list of available subsections appears upon pressing on General in the Administration menu section. It is also possible to switch between subsections by using the title dropdown in the top left corner.
GUI
This section provides customization of several frontend-related defaults.
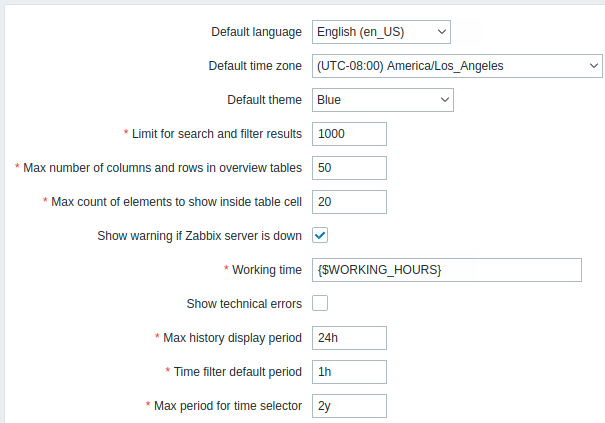
Configuration parameters:
| Parameter | Description |
|---|---|
| Default language | Default language for users who have not specified a language in their profiles and guest users. For more information, see Installation of additional frontend languages. |
| Default time zone | Default time zone for users who have not specified a time zone in their profiles and guest users. |
| Default theme | Default theme for users who have not specified a theme in their profiles and guest users. |
| Limit for search and filter results | Maximum amount of elements (rows) that will be displayed in a web-interface list, for example, in Data collection → Hosts. Note: If set to, for example, '50', only the first 50 elements will be displayed in all affected frontend lists. If some list contains more than fifty elements, the indication of that will be the '+' sign in "Displaying 1 to 50 of 50+ found". Also, if filtering is used and still there are more than 50 matches, only the first 50 will be displayed. Note that increasing the value of this parameter may lead to decreased performance and increased memory consumption on the web server side. |
| Max number of columns and rows in overview tables |
Maximum number of columns and rows to display in Data overview and Trigger overview dashboard widgets. The same limit applies to both columns and rows. If more rows and/or columns than shown exist, the system will display a warning at the bottom of the table: "Not all results are displayed. Please provide more specific search criteria." |
| Max count of elements to show inside table cell |
For entries that are displayed in a single table cell, no more than configured here will be shown. |
| Show warning if Zabbix server is down | This parameter enables a warning message to be displayed in a browser window if the Zabbix server cannot be reached (possibly down). The message remains visible even if the user scrolls down the page. When hovered over, the message is temporarily hidden to reveal the contents underneath it. This parameter is supported since Zabbix 2.0.1. |
| Working time | This system-wide parameter defines working hours. In graphs, working time is displayed as a white background and non-working time is displayed as gray. See Time period specification page for description of the time format. User macros are supported (since Zabbix 3.4.0). |
| Show technical errors | If checked, all registered users will be able to see technical errors (PHP/SQL). If unchecked, the information is only available to Zabbix Super Admins and users belonging to the user groups with enabled debug mode. |
| Max history display period | Maximum time period for which to display historical data in Monitoring subsections: Latest data, Web, and in the Data overview dashboard widget. Allowed range: 24 hours (default) - 1 week. Time suffixes, e.g. 1w (one week), 36h (36 hours), are supported. |
| Time filter default period | Time period to be used in graphs and dashboards by default. Allowed range: 1 minute - 10 years (default: 1 hour). Time suffixes, e.g. 10m (ten minutes), 5w (five weeks), are supported. Note: when a user changes the time period while viewing a graph, this time period is stored as user preference, replacing the global default or a previous user selection. |
| Max period for time selector | Maximum available time period for graphs and dashboards. Users will not be able to visualize older data. Allowed range: 1 year - 10 years (default: 2 years). Time suffixes, e.g. 1y (one year), 365w (365 weeks), are supported. |
Autoregistration
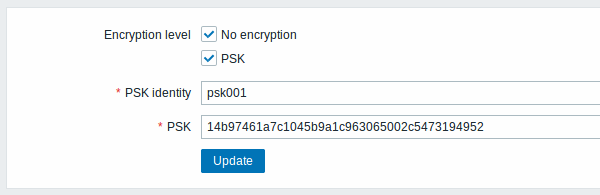
In this section, you can configure the encryption level for active agent autoregistration.
Parameters marked with an asterisk are mandatory.
Configuration parameters:
| Parameter | Description |
|---|---|
| Encryption level | Select one or both options for encryption level: No encryption - unencrypted connections are allowed PSK - TLS encrypted connections with a pre-shared key are allowed |
| PSK identity | Enter the pre-shared key identity string. This field is only available if 'PSK' is selected as Encryption level. Do not put sensitive information in the PSK identity, it is transmitted unencrypted over the network to inform a receiver which PSK to use. |
| PSK | Enter the pre-shared key (an even number of hexadecimal characters). Maximum length: 512 hex-digits (256-byte PSK) if Zabbix uses GnuTLS or OpenSSL library, 64 hex-digits (32-byte PSK) if Zabbix uses mbed TLS (PolarSSL) library. Example: 1f87b595725ac58dd977beef14b97461a7c1045b9a1c963065002c5473194952 This field is only available if 'PSK' is selected as Encryption level. |
See also: Secure autoregistration
Images
The Images section displays all the images available in Zabbix. Images are stored in the database.
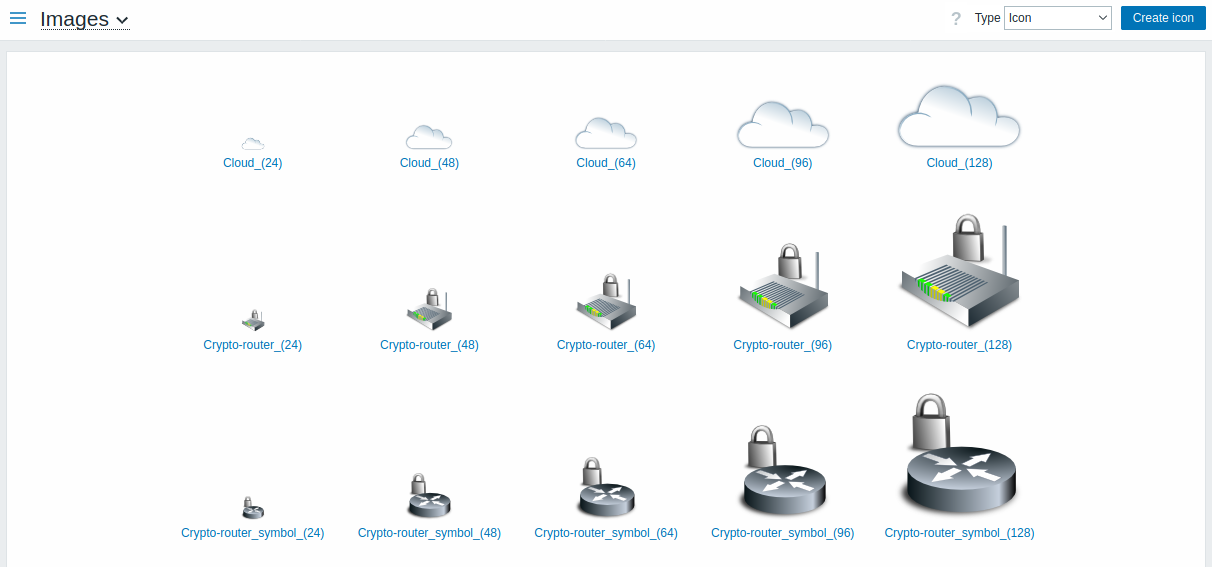
The Type dropdown allows you to switch between icon and background images:
- Icons are used to display network map elements
- Backgrounds are used as background images of network maps
Adding image
You can add your own image by clicking on the Create icon or Create background button in the top right corner.
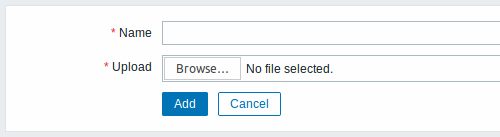
Image attributes:
| Parameter | Description |
|---|---|
| Name | Unique name of an image. |
| Upload | Select the file (PNG, JPEG, GIF) from a local system to be uploaded to Zabbix. Note that it may be possible to upload other formats that will be converted to PNG during upload. GD library is used for image processing, therefore formats that are supported depend on the library version used (2.0.28 or higher is required by Zabbix). |
Maximum size of the upload file is limited by the value of ZBX_MAX_IMAGE_SIZE that is 1024x1024 bytes or 1 MB.
The upload of an image may fail if the image size is close to 1 MB and
the max_allowed_packet MySQL configuration parameter is at a default
of 1MB. In this case, increase the
max_allowed_packet
parameter.
Icon mapping
This section allows creating the mapping of certain hosts with certain icons. Host inventory field information is used to create the mapping.
The mappings can then be used in network map configuration to assign appropriate icons to matching hosts automatically.
To create a new icon map, click on Create icon map in the top right corner.
![]()
Configuration parameters:
| Parameter | Description |
|---|---|
| Name | Unique name of icon map. |
| Mappings | A list of mappings. The order of mappings determines which one will have priority. You can move mappings up and down the list with drag-and-drop. |
| Inventory field | Host inventory field that will be looked into to seek a match. |
| Expression | Regular expression describing the match. |
| Icon | Icon to use if a match for the expression is found. |
| Default | Default icon to use. |
Regular expressions
This section allows creating custom regular expressions that can be used in several places in the frontend. See Regular expressions section for details.
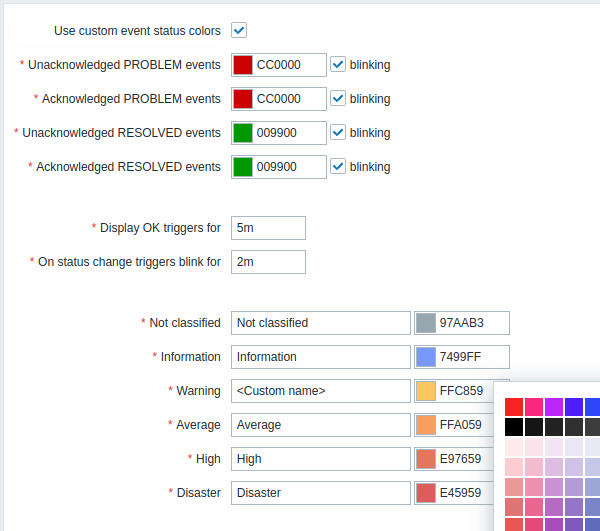
Trigger displaying options
This section allows customizing how trigger status is displayed in the frontend and trigger severity names and colors.
| Parameter | Description |
|---|---|
| Use custom event status colors | Checking this parameter turns on the customization of colors for acknowledged/unacknowledged problems. |
| Unacknowledged PROBLEM events, Acknowledged PROBLEM events, Unacknowledged RESOLVED events, Acknowledged RESOLVED events |
Enter new color code or click on the color to select a new one from the provided palette. If blinking checkbox is marked, triggers will blink for some time upon the status change to become more visible. |
| Display OK triggers for | Time period for displaying OK triggers. Allowed range: 0 - 24 hours. Time suffixes, e.g. 5m, 2h, 1d, are supported. |
| On status change triggers blink for | Length of trigger blinking. Allowed range: 0 - 24 hours. Time suffixes, e.g. 5m, 2h, 1d, are supported. |
| Not classified, Information, Warning, Average, High, Disaster |
Custom severity names and/or colors to display instead of system default. Enter new color code or click on the color to select a new one from the provided palette. Note that custom severity names entered here will be used in all locales. If you need to translate them to other languages for certain users, see Customizing trigger severities page. |
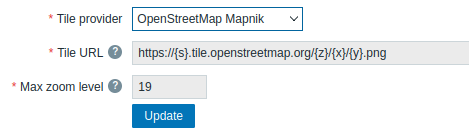
Geographical maps
This section allows selecting geographical map tile service provider and configuring service provider settings for the Geomap dashboard widget. To provide visualization using the geographical maps, Zabbix uses open-source JavaScript interactive maps library Leaflet. Please note that Zabbix has no control over the quality of images provided by third-party tile providers, including the predefined tile providers.
| Parameter | Description |
|---|---|
| Tile provider | Select one of the available tile service providers or select Other to add another tile provider or self-hosted tiles (see Using a custom tile service provider). |
| Tile URL | The URL template for loading and displaying the tile layer on geographical maps. This field is editable only if Tile provider is set to Other. The following placeholders are supported: {s} represents one of the available subdomains; {z} represents zoom level parameter in the URL; {x} and {y} represent tile coordinates; {r} can be used to add "\@2x" to the URL to load retina tiles. Example: https://{s}.example.com/{z}/{x}/{y}{r}.png |
| Attribution text | Tile provider attribution text to be displayed in a small text box on the map. This field is visible only if Tile provider is set to Other. |
| Max zoom level | Maximum zoom level of the map. This field is editable only if Tile provider is set to Other. |
Using a custom tile service provider
The Geomap widget is capable to load raster tile images from a custom self-hosted or a third-party tile provider service. To use a custom third-party tile provider service or a self-hosted tile folder or server, select Other in the Tile provider field and specify the custom URL in the Tile URL field using proper placeholders.
Modules
This section allows to administer custom frontend modules.
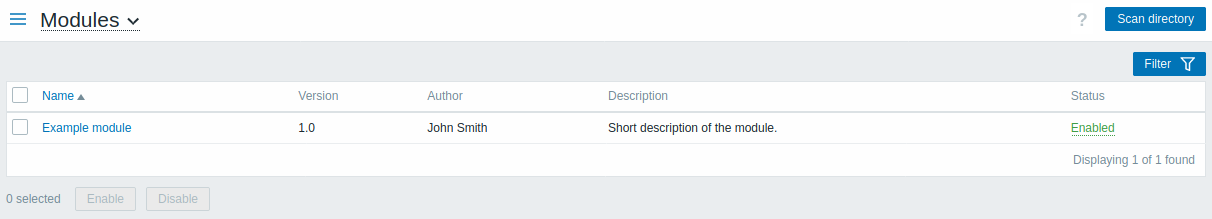
Click on Scan directory to register/unregister any custom modules. Registered modules will appear in the list, along with their details. Unregistered modules will be removed from the list.
You may filter modules by name or status (enabled/disabled). Click on the module status in the list to enable/disable a module. You may also mass enable/disable modules by selecting them in the list and then clicking on the Enable/Disable buttons below the list.
Connectors
This section allows to configure connectors for Zabbix data streaming to external systems over HTTP.
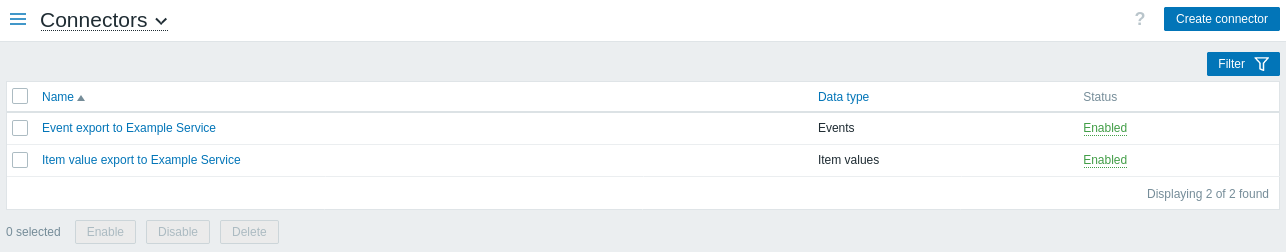
Click on Create connector to configure a new connector.
You may filter connectors by name or status (enabled/disabled). Click on the connector status in the list to enable/disable a connector. You may also mass enable/disable connectors by selecting them in the list and then clicking on the Enable/Disable buttons below the list.
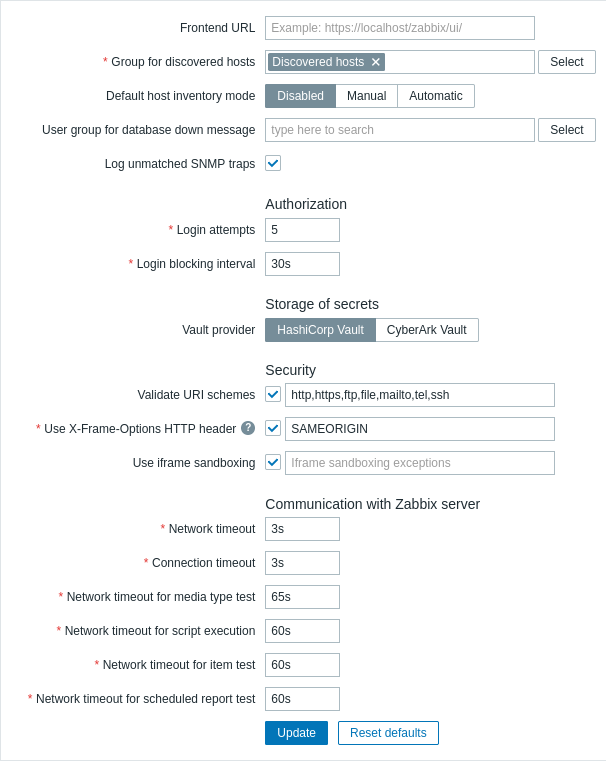
Other parameters
This section allows configuring miscellaneous other frontend parameters.
| Parameter | Description |
|---|---|
| Frontend URL | URL to Zabbix web interface. This parameter is used by Zabbix web service for communication with frontend and should be specified to enable scheduled reports. |
| Group for discovered hosts | Hosts discovered by network discovery and agent autoregistration will be automatically placed in the host group, selected here. |
| Default host inventory mode | Default mode for host inventory. It will be followed whenever a new host or host prototype is created by server or frontend unless overridden during host discovery/autoregistration by the Set host inventory mode operation. |
| User group for database down message | User group for sending alarm message or 'None'. Zabbix server depends on the availability of the backend database. It cannot work without a database. If the database is down, selected users can be notified by Zabbix. Notifications will be sent to the user group set here using all configured user media entries. Zabbix server will not stop; it will wait until the database is back again to continue processing. Notification consists of the following content: [MySQL\|PostgreSQL\|Oracle] database <DB Name> [on <DB Host>:<DB Port>] is not available: <error message depending on the type of DBMS (database)><DB Host> is not added to the message if it is defined as an empty value and <DB Port> is not added if it is the default value ("0"). The alert manager (a special Zabbix server process) tries to establish a new connection to the database every 10 seconds. If the database is still down the alert manager repeats sending alerts, but not more often than every 15 minutes. |
| Log unmatched SNMP traps | Log SNMP trap if no corresponding SNMP interfaces have been found. |
Authorization
| Parameter | Description |
|---|---|
| Login attempts | Number of unsuccessful login attempts before the possibility to log in gets blocked. |
| Login blocking interval | Period of time for which logging in will be prohibited when Login attempts limit is exceeded. |
Storage of secrets
Vault provider parameter allows selecting secret management software for storing user macro values. Supported options:
- HashiCorp Vault (default)
- CyberArk Vault
See also: Storage of secrets.
Security
| Parameter | Description |
|---|---|
| Validate URI schemes | Unmark this checkbox to disable URI scheme validation (enabled by default). If marked, you can specify a comma-separated list of allowed URI schemes (default: http,https,ftp,file,mailto,tel,ssh). Applies to all fields in the frontend where URIs are used (for example, map element URLs). |
| Use X-Frame-Options HTTP header | Unmark this checkbox to disable the HTTP X-Frame-options header (not recommended). If marked, you can specify the value of the HTTP X-Frame-options header. Supported values: SAMEORIGIN (default) or 'self' (must be single-quoted) - the page can only be displayed in a frame on the same origin as the page itself; DENY or 'none' (must be single-quoted) - the page cannot be displayed in a frame, regardless of the site attempting to do so; a string of space-separated hostnames; adding 'self' (must be single-quoted) to the list allows the page to be displayed in a frame on the same origin as the page itself. Note that using 'self' or 'none' without single quotes will result in them being regarded as hostnames. |
| Use iframe sandboxing | Unmark this checkbox to disable putting the retrieved URL content into sandbox (not recommended). If marked, you can specify the iframe sandboxing exceptions; unspecified restrictions will still be applied. If this field is empty, all sandbox attribute restrictions apply. For more information, see the description of the sandbox attribute. |
Communication with Zabbix server
| Parameter | Description |
|---|---|
| Network timeout | How many seconds to wait before closing an idle socket (if a connection to Zabbix server has been established earlier, but frontend can not finish read/send data operation during this time, the connection will be dropped). Allowed range: 1 - 300s (default: 3s). |
| Connection timeout | How many seconds to wait before stopping an attempt to connect to Zabbix server. Allowed range: 1 - 30s (default: 3s). |
| Network timeout for media type test | How many seconds to wait for a response when testing a media type. Allowed range: 1 - 300s (default: 65s). |
| Network timeout for script execution | How many seconds to wait for a response when executing a script. Allowed range: 1 - 300s (default: 60s). |
| Network timeout for item test | How many seconds to wait for returned data when testing an item. Allowed range: 1 - 300s (default: 60s). |
| Network timeout for scheduled report test | How many seconds to wait for returned data when testing a scheduled report. Allowed range: 1 - 300s (default: 60s). |