
2 Hosts
Overview
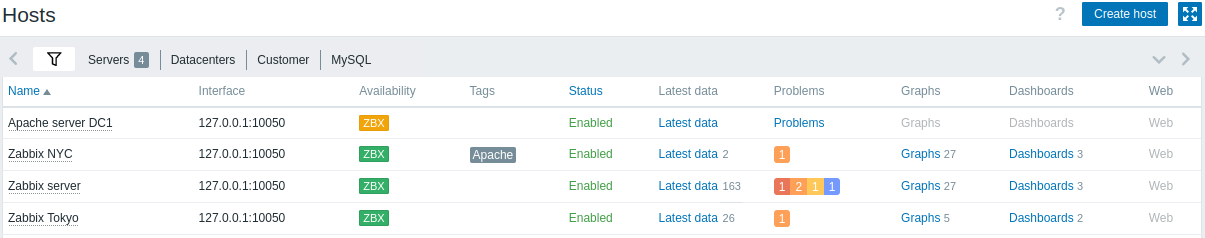
The Monitoring → Hosts section displays a full list of monitored hosts with detailed information about host interface, availability, tags, current problems, status (enabled/disabled), and links to easily navigate to the host's latest data, problem history, graphs, dashboards and web scenarios.
| Column | Description |
|---|---|
| Name | The visible host name. Clicking on the name brings up the host menu. An orange wrench icon Click on the column header to sort hosts by name in ascending or descending order. |
| Interface | The main interface of the host is displayed. |
| Availability | Host availability per configured interface is displayed. Availability icons represent host interface current status on Zabbix server. Therefore, if you disable a host in the frontend, its availability will update after Zabbix server has synchronized the configuration changes. Similarly, if you enable a host, its availability will update after Zabbix server has synchronized the configuration changes and polled the host. Availability icons represent only those interface types (Agent, SNMP, IPMI, JMX) that are configured. Hovering over the icon displays a pop-up with a list of all interfaces of the same type with details, status, and errors. For Agent interface, the pop-up displays interfaces (passive) and active checks. If a host has active checks only, the Agent interface icon is displayed even if the host does not have an Agent interface (passive) configured. The column is empty for hosts with no interfaces. The current status of all interfaces of one type is indicated by the icon color: Green - all interfaces are available; Yellow - at least one interface is not available, and at least one is available or unknown; Red - all interfaces are not available; Gray - at least one interface is unknown, but none are not available. For details on how Zabbix server determines the "Unknown" status, see Unknown interface status. Active check availability. Active checks also affect host interface availability if at least one active check is enabled on the host. Active check availability is counted towards the total Agent interface availability as described above. For example, if a host has an Agent interface (passive) that is available, but active checks are unknown, the total Agent interface availability is displayed as gray (unknown). Note: Since Zabbix 6.4.12, there are two exceptions for determining the total Agent interface availability: - if active checks are available, but at least one Agent interface (passive) is unknown while the host also has at least one item using this interface, the total Agent interface availability is displayed as gray (unknown); - if active checks are available and all Agent interfaces (passive) are unknown (and no items are using this interface), the total Agent interface availability is displayed as green (available). To determine active check availability, heartbeat messages are sent in the agent active check thread. The frequency of heartbeat messages is controlled by the HeartbeatFrequency parameter in Zabbix agent or agent 2 configuration (default 60 seconds, range 0-3600). Active checks are considered unavailable when the active check heartbeat is older than 2 x HeartbeatFrequency seconds.Note: Zabbix agents older than version 6.2.x do not send active check heartbeats, so the availability of their hosts remains unknown. |
| Tags | Tags of the host and all linked templates, with macros unresolved. |
| Status | Host status - Enabled or Disabled. Click on the column header to sort hosts by status in ascending or descending order. |
| Latest data | Clicking on the link will open the Monitoring - Latest data page with all the latest data collected from the host. The number of items with latest data is displayed in gray. |
| Problems | The number of open host problems sorted by severity. The color of the square indicates problem severity. The number on the square means the number of problems for the given severity. Clicking on the icon will open Monitoring - Problems page for the current host. If a host has no problems, a link to the Problems section for this host is displayed as text. Use the filter to select whether suppressed problems should be included (not included by default). |
| Graphs | Clicking on the link will display graphs configured for the host. The number of graphs is displayed in gray. If a host has no graphs, the link is disabled (gray text) and no number is displayed. |
| Dashboards | Clicking on the link will display dashboards configured for the host. The number of dashboards is displayed in gray. If a host has no dashboards, the link is disabled (gray text) and no number is displayed. |
| Web | Clicking on the link will display web scenarios configured for the host. The number of web scenarios is displayed in gray. If a host has no web scenarios, the link is disabled (gray text) and no number is displayed. |
Buttons
Create host allows to create a new host. This button is available for Admin and Super Admin users only.
View mode buttons being common for all sections are described on the Monitoring page.
Using filter
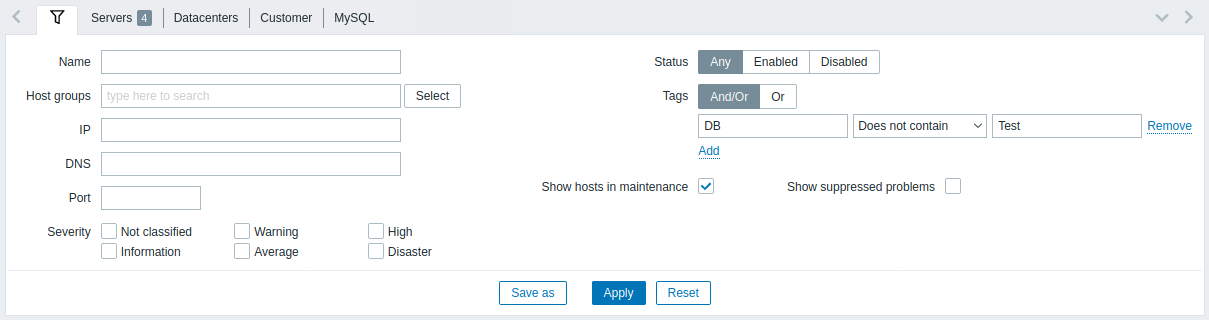
You can use the filter to display only the hosts you are interested in. For better search performance, data is searched with macros unresolved.
The filter is located above the table. It is possible to filter hosts by name, host group, IP or DNS, interface port, tags, problem severity, status (enabled/disabled/any); you can also select whether to display suppressed problems and hosts that are currently in maintenance.
| Parameter | Description |
|---|---|
| Name | Filter by visible host name. |
| Host groups | Filter by one or more host groups. Specifying a parent host group implicitly selects all nested host groups. |
| IP | Filter by IP address. |
| DNS | Filter by DNS name. |
| Port | Filter by port number. |
| Severity | Filter by problem severity. By default problems of all severities are displayed. Problems are displayed if not suppressed. |
| Status | Filter by host status. |
| Tags | Filter by host tag name and value. Hosts can be filtered by host-level tags as well as tags from all linked templates, including nested templates. It is possible to include as well as exclude specific tags and tag values. Several conditions can be set. Tag name matching is always case-sensitive. There are several operators available for each condition: Exists - include the specified tag names Equals - include the specified tag names and values (case-sensitive) Contains - include the specified tag names where the tag values contain the entered string (substring match, case-insensitive) Does not exist - exclude the specified tag names Does not equal - exclude the specified tag names and values (case-sensitive) Does not contain - exclude the specified tag names where the tag values contain the entered string (substring match, case-insensitive) There are two calculation types for conditions: And/Or - all conditions must be met, conditions having the same tag name will be grouped by the Or condition Or - enough if one condition is met |
| Show hosts in maintenance | Mark the checkbox to display hosts that are in maintenance (displayed by default). |
| Show suppressed problems | Mark the checkbox to display problems that would otherwise be suppressed (not shown) because of host maintenance or single problem suppression. |
Saving filter
Favorite filter settings can be saved as tabs and then quickly accessed by clicking on the respective tab above the filter.
See more details about saving filters.