
Gráfico de dispersão
Visão geral
O widget Scatter plot exibe a relação entre duas métricas ao plotar pontos de dados individuais ao longo dos eixos X e Y. Isso ajuda a revelar padrões, agrupamentos, correlações e valores atípicos no conjunto de dados.
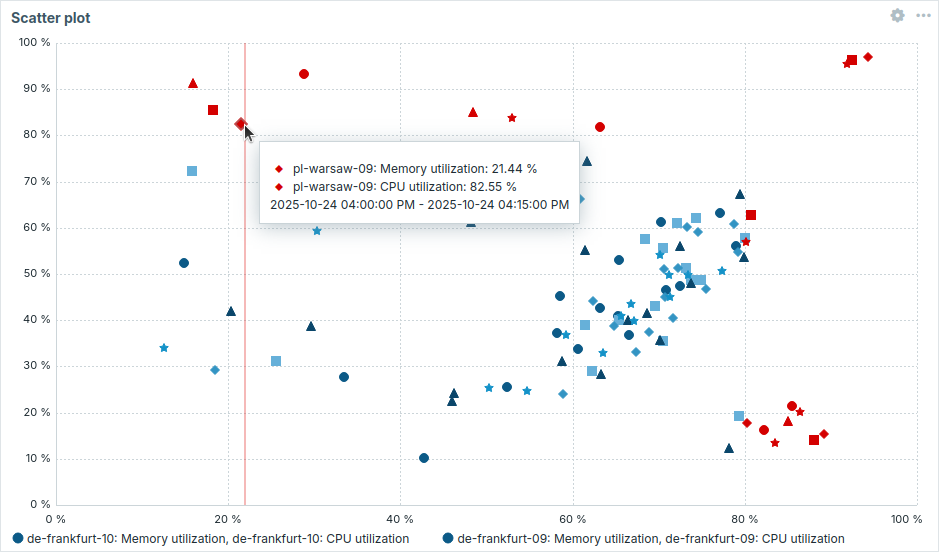
Ao passar o cursor sobre um ponto de dados, é exibida uma dica de ferramenta com uma lista de itens desse ponto de dados e de outros pontos dentro de um raio de 6 px; ordenados primeiro pelos valores do eixo X do gráfico de dispersão em ordem crescente e depois pelos valores do eixo Y em ordem decrescente.
Ao selecionar um item na dica de ferramenta, seus dados são transmitidos para outros widgets.
As informações exibidas no widget Scatter plot podem ser baixadas como uma imagem PNG selecionando a opção Download image no menu do widget.
Configuração
Para configurar, selecione Gráfico de dispersão como tipo:

Conjunto de dados
A aba Conjunto de dados permite selecionar dados para o gráfico de dispersão adicionando conjuntos de dados. Dois tipos de conjuntos de dados podem ser adicionados:
- Padrões de item - hosts com items correspondentes são exibidos como pontos de dados. Você pode escolher uma cor base única ou selecionar uma linha da paleta para atribuir cores distintas a cada host com os items correspondentes.
- Lista de item - os items selecionados são exibidos como pontos de dados, em que cada ponto representa um par de items (X e Y). Você pode escolher a cor de cada conjunto de dados individualmente no seletor.
Os pontos de dados são criados apenas para aqueles pares de host/item que tenham pelo menos um valor em ambos os eixos.
Por padrão, um conjunto de dados Padrões de item é adicionado.
| Conjunto de dados | Para o conjunto de dados Padrões de item: Selecione ou insira padrões de host e item; os dados dos items que corresponderem a esses padrões serão exibidos no gráfico de dispersão. Observe que, se o número de pontos de dados exceder 8k, memory_limit deve ser aumentado no arquivo de configuração php.ini. O limite de memória recomendado para 20k pontos de dados é 512 MB.Padrões curinga podem ser usados para seleção (por exemplo, * retornará resultados que correspondem a zero ou mais caracteres).Para especificar um padrão curinga, insira a string manualmente e pressione Enter. O símbolo curinga é sempre interpretado, portanto não é possível adicionar, por exemplo, um item chamado item* individualmente se houver outros items correspondentes (por exemplo, item2, item3). Especificar padrões de host e item é obrigatório para conjuntos de dados "Padrões de item". Veja também: Detalhes da configuração do conjunto de dados. Para o conjunto de dados Lista de item: Selecione items para o gráfico de dispersão clicando no botão Adicionar item. Você também pode selecionar widgets compatíveis como fonte de dados para items clicando no botão Adicionar widget. Especificar items ou widgets é obrigatório para conjuntos de dados "Lista de item". Veja também: Detalhes da configuração do conjunto de dados. Observe que somente tipos numéricos de item são permitidos. Ao configurar o widget em um painel de template, o parâmetro para especificar padrões de host não está disponível, e o parâmetro para especificar uma lista de items permite selecionar apenas os items configurados no template. |
|
| Grupos de host | Selecione grupos de host. Como alternativa, selecione um widget compatível como fonte de dados para grupos de host. Este campo tem autocompletar, então começar a digitar o nome de um grupo exibirá uma lista suspensa com os grupos correspondentes. Especificar um grupo de host pai seleciona implicitamente todos os grupos de host aninhados. Os dados de host desses grupos de host serão exibidos no widget; se nenhum grupo de host for informado, todos os grupos de host serão exibidos. Este parâmetro está disponível apenas para conjuntos de dados Padrões de item e não está disponível ao configurar o widget em um painel de template. |
|
| Tags de host | Especifique tags para filtrar os hosts exibidos no widget. É possível incluir e também excluir tags e valores de tag específicos. Várias condições podem ser definidas. A correspondência do nome da tag é sempre sensível a maiúsculas e minúsculas. Há vários operadores disponíveis para cada condição: Exists - inclui os nomes de tag especificados; Equals - inclui os nomes e valores de tag especificados (sensível a maiúsculas e minúsculas); Contains - inclui os nomes de tag especificados cujos valores de tag contenham a string informada (correspondência de substring, sem diferenciar maiúsculas de minúsculas); Does not exist - exclui os nomes de tag especificados; Does not equal - exclui os nomes e valores de tag especificados (sensível a maiúsculas e minúsculas); Does not contain - exclui os nomes de tag especificados cujos valores de tag contenham a string informada (correspondência de substring, sem diferenciar maiúsculas de minúsculas). Há dois tipos de cálculo para as condições: And/Or - todas as condições devem ser atendidas, e as condições com o mesmo nome de tag serão agrupadas pela condição Or; Or - basta que uma condição seja atendida. Este parâmetro está disponível apenas para conjuntos de dados Padrões de item e não está disponível ao configurar o widget em um painel de template. |
|
| Substituir host | Selecione um widget compatível ou o seletor de host do painel como fonte de dados para hosts. Este parâmetro não está disponível ao configurar o widget em um painel de template. |
|
| Marcador | Escolha o tipo e o tamanho do marcador para os pontos de dados de host no conjunto de dados. | |
| Deslocamento de tempo | Especifique o deslocamento de tempo, se necessário. Você pode usar sufixos de tempo neste campo. Valores negativos são permitidos. |
|
| Função de agregação | Especifique qual função de agregação usar para cada item no conjunto de dados dentro do Intervalo de agregação selecionado: min - exibe o menor valor; max - exibe o maior valor; avg - exibe o valor médio; sum - exibe a soma dos valores; count - exibe a contagem de valores (se existir pelo menos um valor em ambos os eixos); first - exibe o primeiro valor; last - exibe o último valor. A agregação permite exibir um valor agregado para o intervalo escolhido (5 minutos, uma hora, um dia), em vez de todos os valores. Apenas dados numéricos podem ser exibidos para min, max, avg e sum. Para count, dados não numéricos serão convertidos para numéricos. |
|
| Intervalo de agregação | Especifique o intervalo para agregar valores. Você pode usar sufixos de tempo neste campo. Um valor numérico sem sufixo será considerado em segundos. Observe que, se o widget estiver configurado para exibir dados históricos com base em trends (Seleção de dados históricos estiver definida como Trends ou Auto), é recomendável usar um intervalo de agregação que seja múltiplo de 1 hora (por exemplo, 3600, 60m, 1h, 3h etc.). As trends armazenam valores agregados por hora, portanto usar um intervalo de agregação que não seja múltiplo de 1 hora (por exemplo, 100s, 7min, 15min, 90min etc.) pode levar a resultados difíceis de interpretar. Especificar um intervalo de agregação é obrigatório. O intervalo de agregação determina o intervalo de tempo e as coordenadas de um ponto de dados; por exemplo, se os items do eixo X tiverem 4 valores e os items do eixo Y tiverem 1 valor, as coordenadas refletem a agregação de 4 no X e 1 no Y no intervalo especificado. |
|
Detalhes da configuração do conjunto de dados
Os conjuntos de dados existentes são exibidos em uma lista. Você pode reorganizar, expandir/recolher, alterar cores e clonar esses conjuntos de dados.
Para mais informações, consulte detalhes da configuração do conjunto de dados no widget Gráfico. Esses detalhes também se aplicam ao widget Gráfico de dispersão.
Opções de exibição
A aba Opções de exibição permite definir a seleção de dados do histórico:

| Seleção de dados do histórico | Defina a origem dos dados do gráfico de dispersão: Auto - os dados são obtidos de acordo com o algoritmo do gráfico clássico (padrão). Histórico - dados do histórico. Tendências - dados de tendências. |
| Nomes de hosts nos rótulos | Escolha se os nomes dos hosts devem ser exibidos na legenda do gráfico e na dica de ferramenta que aparece ao passar o cursor sobre os dados do gráfico: Auto - os nomes dos hosts são exibidos somente se mais de um host estiver presente nos conjuntos de dados (padrão). Mostrar - os nomes dos hosts são exibidos. Ocultar - os nomes dos hosts ficam ocultos. Este parâmetro não está disponível ao configurar o widget em um dashboard de template. |
Período de tempo
A aba Período de tempo permite definir um período de tempo para exibir dados no gráfico de dispersão:
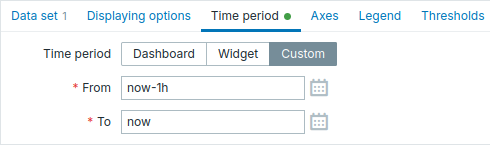
| Período de tempo | Selecione a fonte de dados para o período de tempo: Dashboard - usa o seletor de período de tempo do dashboard; Widget - usa um widget compatível (definido no parâmetro Widget); Personalizado - usa um período de tempo personalizado definido nos parâmetros De e Até; se definido, um ícone de relógio será exibido no canto superior direito do widget, indicando o tempo definido ao passar o mouse. Observe que, independentemente da configuração de Período de tempo do widget, widgets compatíveis ainda podem usá-lo como fonte de dados para o período de tempo. |
| Widget | Digite ou selecione um widget compatível como fonte de dados para o período de tempo. Este parâmetro está disponível se Período de tempo estiver definido como "Widget". |
| De | Digite ou selecione o início do período de tempo. A sintaxe de tempo relativo ( now, now/d, now/w-1w, etc.) é suportada.Este parâmetro está disponível se Período de tempo estiver definido como "Personalizado". |
| Até | Digite ou selecione o final do período de tempo. A sintaxe de tempo relativo ( now, now/d, now/w-1w, etc.) é suportada.Este parâmetro está disponível se Período de tempo estiver definido como "Personalizado". |
Eixos
A guia Eixos permite personalizar como os eixos são exibidos:
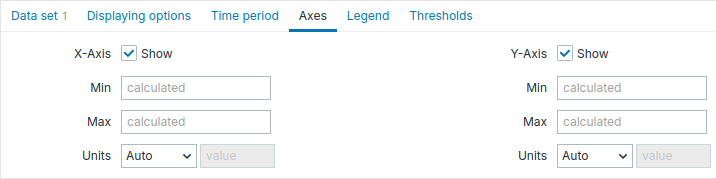
| Eixo X/Eixo Y | Desmarque esta caixa de seleção para ocultar o eixo X/Y (marcada por padrão). |
| Mín | Defina o valor mínimo do eixo correspondente. |
| Máx | Defina o valor máximo do eixo correspondente. |
| Unidades | Escolha a unidade para os valores do eixo do gráfico de dispersão no menu suspenso: Automático - os valores do eixo são exibidos usando a unidade do primeiro item no conjunto de dados; Estático - os valores do eixo são exibidos usando a unidade especificada no campo de entrada valor; se o campo for deixado em branco, apenas valores numéricos serão exibidos. |
Legenda
A aba Legenda permite personalizar a legenda do gráfico de dispersão:
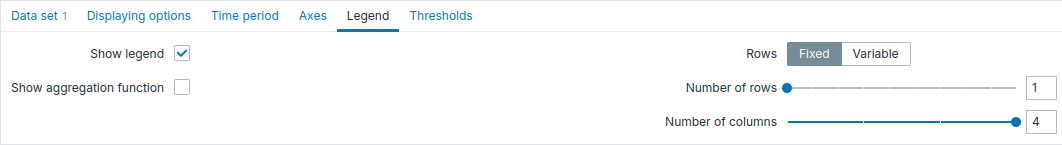
| Exibir legenda | Desmarque esta caixa de seleção para ocultar a legenda no gráfico de dispersão (marcada por padrão). |
| Exibir função de agregação | Marque esta caixa de seleção para exibir a função de agregação na legenda. |
| Linhas | Selecione o modo de exibição para as linhas da legenda: Fixo - o número de linhas exibidas é determinado pelo valor do parâmetro Número de linhas; Variável - o número de linhas exibidas é determinado pela quantidade de items configurados, sem exceder o valor do parâmetro Número máximo de linhas. |
| Número de linhas/ Número máximo de linhas |
Se Linhas estiver definido como "Fixo", defina o número de linhas da legenda a serem exibidas (1-10). Se Linhas estiver definido como "Variável", defina o número máximo de linhas da legenda a serem exibidas (1-10). |
| Número de colunas | Defina o número de colunas da legenda a serem exibidas (1-4). Este parâmetro está disponível se Exibir min/méd/max estiver desmarcado. |
Limiares
A aba Limiares permite configurar limiares que determinam as cores dos marcadores de host:
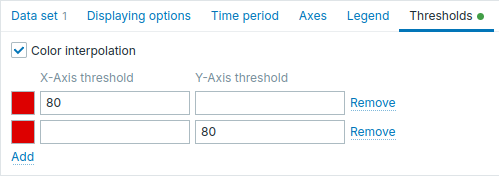
| Interpolação de cor | Marque a caixa de seleção para ativar a transição suave entre as cores dos limiares para os marcadores de host. Este parâmetro se aplica se dois ou mais limiares forem definidos para o eixo X, o eixo Y ou ambos os eixos simultaneamente. |
| Limiar do eixo X/Y | Clique em Adicionar para adicionar um limiar, selecione uma cor de limiar no seletor de cores e especifique um valor numérico. Os limiares podem ser aplicados a um único eixo, a ambos os eixos separadamente ou a ambos os eixos simultaneamente. Por exemplo, um único limiar com X=80 e Y=80 irá colorir os marcadores quando ambas as condições forem atendidas. A lista de limiares será classificada em ordem crescente ao ser salva. Sufixos (por exemplo, "1d", "2w", "4K", "8G") são suportados. Mapeamentos de valores são suportados. |