
- 6 What's new in Zabbix 1.8.2
6 What's new in Zabbix 1.8.2
Frontend changes
Dashboard filtering
Zabbix dashboard now can be filtered. Positioned at the upper right corner, just next to the fullscreen button, is the configuration button
 .
.
After pressing this button, filter configuration is revealed. By default filtering is disabled and none of the options is available.
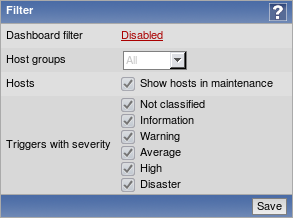
Filter can be customised per user account.
Clicking the Disabled control will enable the filter and allow to configure it. There are three available filtering categories.
Host group filter
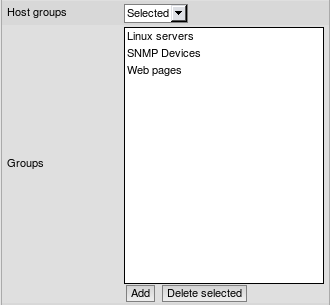
This filter allows to choose which groups should be shown on the dashboard. By default, all host groups are shown. Choosing Selected in the dropdown allows to choose individual hostgroups to show.
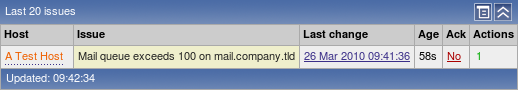
This filtering affects System status, Host status, Last 20 issues and Web monitoring widgets.
If host group filter is enabled, but no groups are selected, no data will be shown in the affected dashboard widgets.
Maintenance filter
By default, all data for hosts that are in a maintenance is shown on the dashboard. Unchecking Show hosts in maintenance option will hide this information.

This filtering affects System status, Host status, Last 20 issues and Web monitoring widgets.
Trigger severity filter
Additionally, it is possible to filter shown data based on trigger severity.
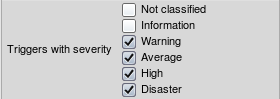
This filtering affects System status, Host status and Last 20 issues widgets. For System status widget, corresponding columns are hidden.
Filter indication
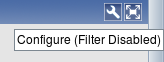
Clicking Save will return to the dashboard. To indicate an enabled
filter, configuration button is highlighted -
 .
.
Additionally, depending on filter state, button tooltip explains what it is indicating.
 |
 |
| Dashboard filter disabled | Dashboard filter enabled |
Time period selector changes
Starting with 1.8.2, there are two changes:
Time period selector moved to the top
Now time period scrollbar is part of the filter at the top of the page. In addition to being on top for all pages, it can be hidden by collapsing the filter.
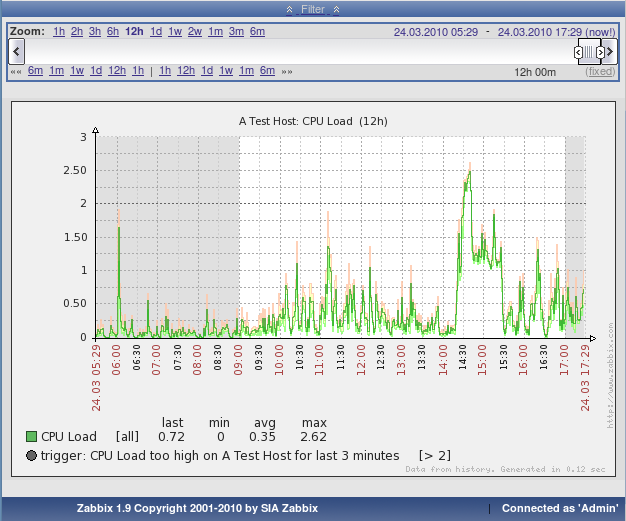 |
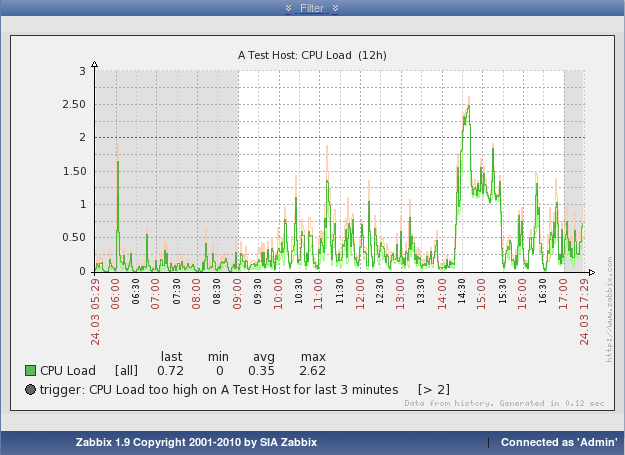 |
| Expanded period scrollbar | Collapsed period scrollbar |
Improved events and auditlog time period selection
Instead of providing very limited "Since" time filter, both event view and audit/action log now use the same standard time period scrollbar.
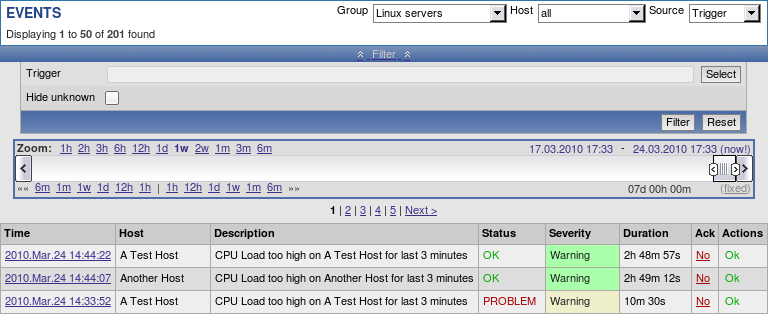 |
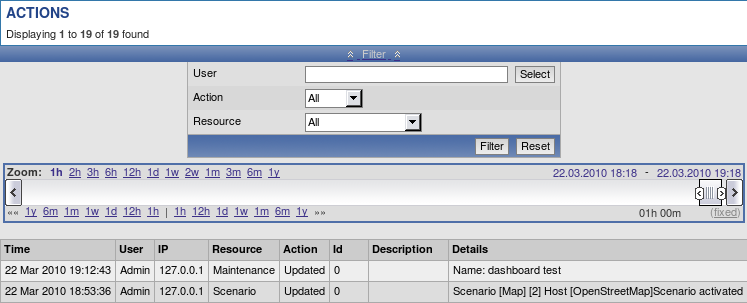 |
| Period selector in events | Period selector in audit |
Map and screen exporting and importing
Map exporting and importing
Support for network map exporting and importing was added. Maps can now be exported from their configuration screen:
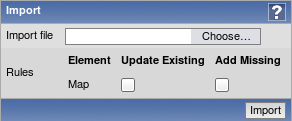
And on the same screen the import button can be found:

When importing, it is possible to choose whether overwrite existing maps and add new ones:
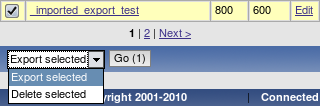
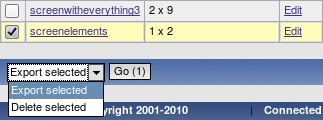
Screen exporting and importing
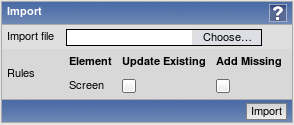
Support for screen exporting and importing was added. Screens can now be exported from their configuration screen:
And on the same screen the import button can be found:

When importing, it is possible to choose whether overwrite existing maps and add new ones:
More configurability for "Status of triggers" screen element
Screen element "Status of triggers" now is split in two new elements:
- Status of host triggers;
- Status of hostgroup triggers.
They allow to choose a host or host group to filter element contents on, respectively. If any is chosen, there are no host and hostgroup dropdowns. If none is chosen, element works as before - interactive hostgroup and host dropdowns allow to choose filter options in the fly.
Translation updates
The following new translations have been added:
- Ukrainian.
The following translations have been updated:
- Brazilian Portuguese;
- French;
- Russian.
Frontend requirement changes
- PHP parameter max_input_time is now required to be at least 300;
- PHP parameter upload_max_filesize must be at least 2MB;
- Parameter mbstring.func_overload not required anymore.
Miscellaneous frontend changes
- Host maintenance is now displayed in dashboard by colouring host name:
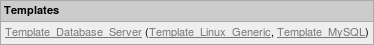
- When viewing host list in configuration, one more level of linked templates is now displayed in addition to the directly linked templates. For each directly linked template, a list in parenthesis shows templates that template is linked to itself.
- Frontend now always uses PHP timezone. It will not use browser time anymore. This should solve issues with mangled time, graphs working erroneously if browser timezone differs from PHP timezone and other issues.
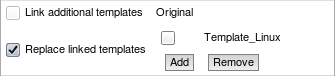
<!-- -->- Added an ability to replace already linked templates when performing host mass update.
- API version increased to 1.2.
Improved triggers
In Zabbix 1.8.2, some trigger functions and expressions have gained new features.
Time-shifting in triggers
Trigger functions min, max, avg, last and count now support additional parameter - time_shift. This parameter allows to match data from a specific period of time in past.
For example, avg(3600,86400) will return the average value for an hour one day ago. This way it is possible to compare average load today with average load of the same time yesterday:
{host:system.cpu.load.avg(3600)}/{host:system.cpu.load.avg(3600,86400)}>2This expression would fire if average load for the last hour today exceeds average load of the same hour yesterday more than two times.
Additional suffixes in trigger expressions
Support for new suffixes has been added. New numeric suffixes:
- T - tera;
New time-related suffixes:
- s - seconds; when used, works the same as raw value;
- m - minutes;
- h - hours;
- d - days
- w - weeks.
These improvements allow to write expressions that are easier to understand and maintain, for example the following expressions:
{host:zabbix[proxy,zabbix_proxy,lastaccess]}>120
{host:system.uptime[].last()}<86400
could be changed to:
{host:zabbix[proxy,zabbix_proxy,lastaccess]}>2m
{host:system.uptime.last()}<1d
Improved items
- Telnet items now additionally support % as prompt termination character;
- Aggregate items now
support:
- Comma delimited list of host groups;
- Item keys with doublequotes.
- Item key parameters now support arrays.
Other changes
- In previous versions, Zabbix server was able to reconnect to MySQL database if it temporarily became unavailable. With 1.8.2, this is also supported for PostgreSQL, Oracle and SQLite.
- Zabbix administrators now can only choose groups they are members of and users of those groups in action operations. Additionally, they do not have access to actions that have users or groups in their operations that administrator does not share a group with, or is not a member of, respectively.
New configuration parameters
- Zabbix server and proxy daemons now have new option - LogSlowQueries. Mostly helpful with performance debugging.
- Zabbix agent daemon has a new configuration parameter - UnsafeUserParameters. This allows to override security checks and pass all characters in user parameter arguments.
- Zabbix server daemon has a new configuration paramater - MaxHousekeeperDelete. Previously, housekeeper always removed 500 entries in one go. This amount can be customised now. If set to 0, no limit is applied.
Performance improvements
- Node synchronisation received further performance improvements;
- Various frontend sections use less memory and perform better.
More robust escalation module
Since version 1.8.2 any old escalations are removed for a particular trigger when adding new one. This should prevent multiple recovery messages (as they also use escalation module), neverending escalations because of misconfiguration and other problems.
Improved zabbix_sender
Zabbix sender has gained ability to get its input from standard input when specifying - as the input file. Additionally, -r flag makes it send new values as soon as they arrive, thus allowing to follow a file that gets information appended, or open a pipe and transmit its data as soon as it arrives.