
4 Monitoring an agent-enabled host
The section provides details about monitoring a host which has Zabbix agent running. You must have the agent installed and configured properly.
Monitoring default Zabbix server
Open Configuration → Hosts to see the list of currently defined hosts. The situation will be different depending on Zabbix version being used.
- If you are using Zabbix up to version 1.8.3, you will see single disabled host, Zabbix server.
- If you are using Zabbix appliance version 1.8.3 or later, you will see single enabled host, Zabbix server.
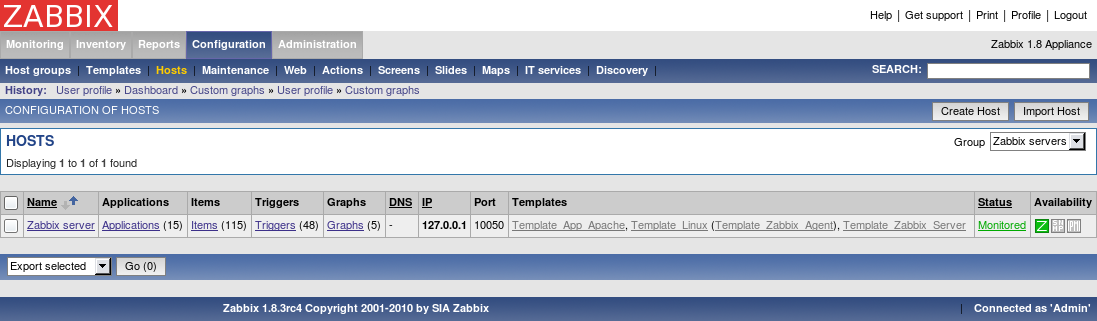
If the host is not monitored, click on Not monitored in the Status column and confirm the popup. That's it, we don't have to do anything else - if agent and server daemons are running properly, the host will be monitored from now on.
Monitoring a different server
Open Configuration → Hosts to see the list of currently defined hosts. There will be one pre-defined host, but now we want to add another one.
Click on Create host. As the minimum, host definition for our purposes should have the following defined:
- Host name;
- Host must belong to at least one hostgroup;
- For passive Zabbix agent monitored hosts IP address should be defined;
- For a quickstart, we will use one of the pre-defined templates as well.
Other options will suit us with their defaults.
Host name
- Enter a host name here. Alpha-numericals, spaces and underscores are allowed.
Groups
- Host must belong to at least one host group. Move groups from the right hand side box to the left hand side box and the opposite until you are satisfied with the result.
IP address
- Enter the IP address of the host. Note that Zabbix agent daemon must have Zabbix server IP address specified in its configuration file Server directive.
Linked templates
- On the right hand side block Linked templates, click on the Add button, choose Templates in the Group dropdown, then mark checkbox next to Template_Linux entry (assuming the newly added host is running Linux) and click on Select.
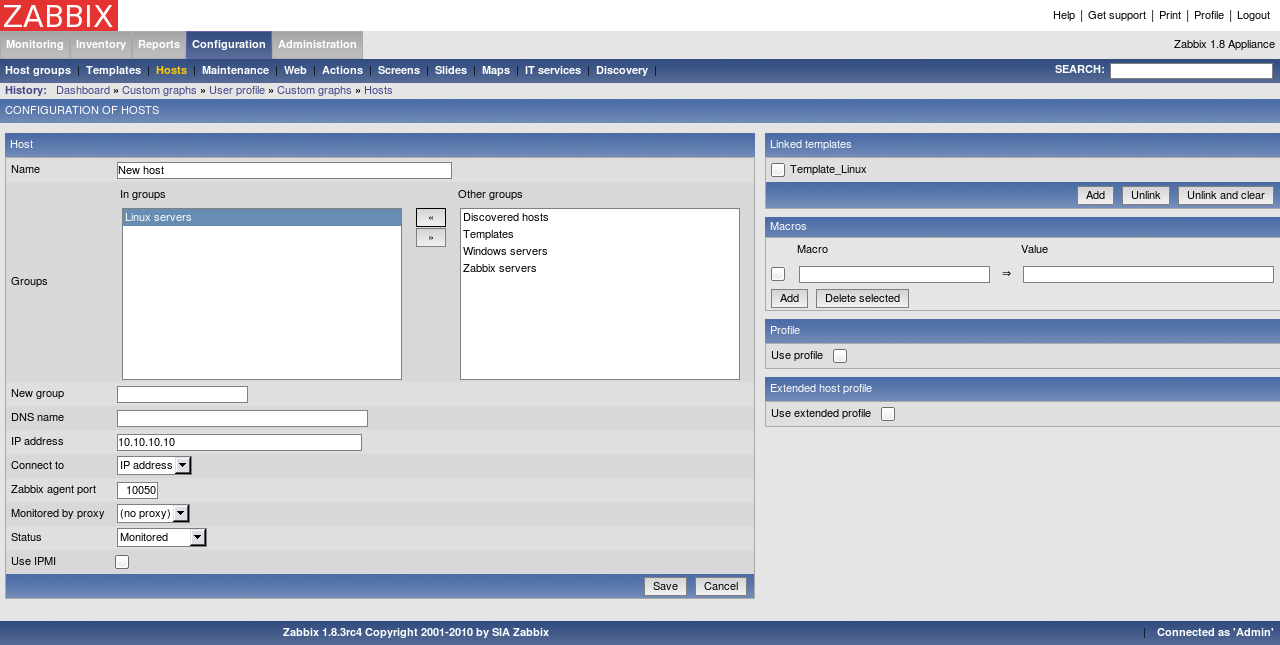
When done, click Save.
The host should be successfully created. Click on Details in the upper left corner of the resulting page - that should show you what actually happened.
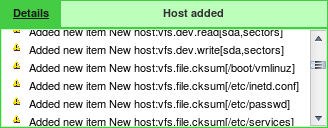
According to the details, the effect of using a template should be that this new host now has entities from Template_Linux - let's verify that. In the Group dropdown, choose one of the groups you added your new host to. That should show a high level configuration overview of this host.
Verifying current configuration

In this list we can see that several items, triggers and graphs supposedly have been added to our new host.
If the Z icon in the Availability column is red, there is some error with communication - move your mouse cursor over it to see the error message. If that icon is gray, no status update has happened so far. Check that Zabbix server is running, and try refreshing the page later as well.
Let's make sure that this host indeed has those items. Click on Items next to it.
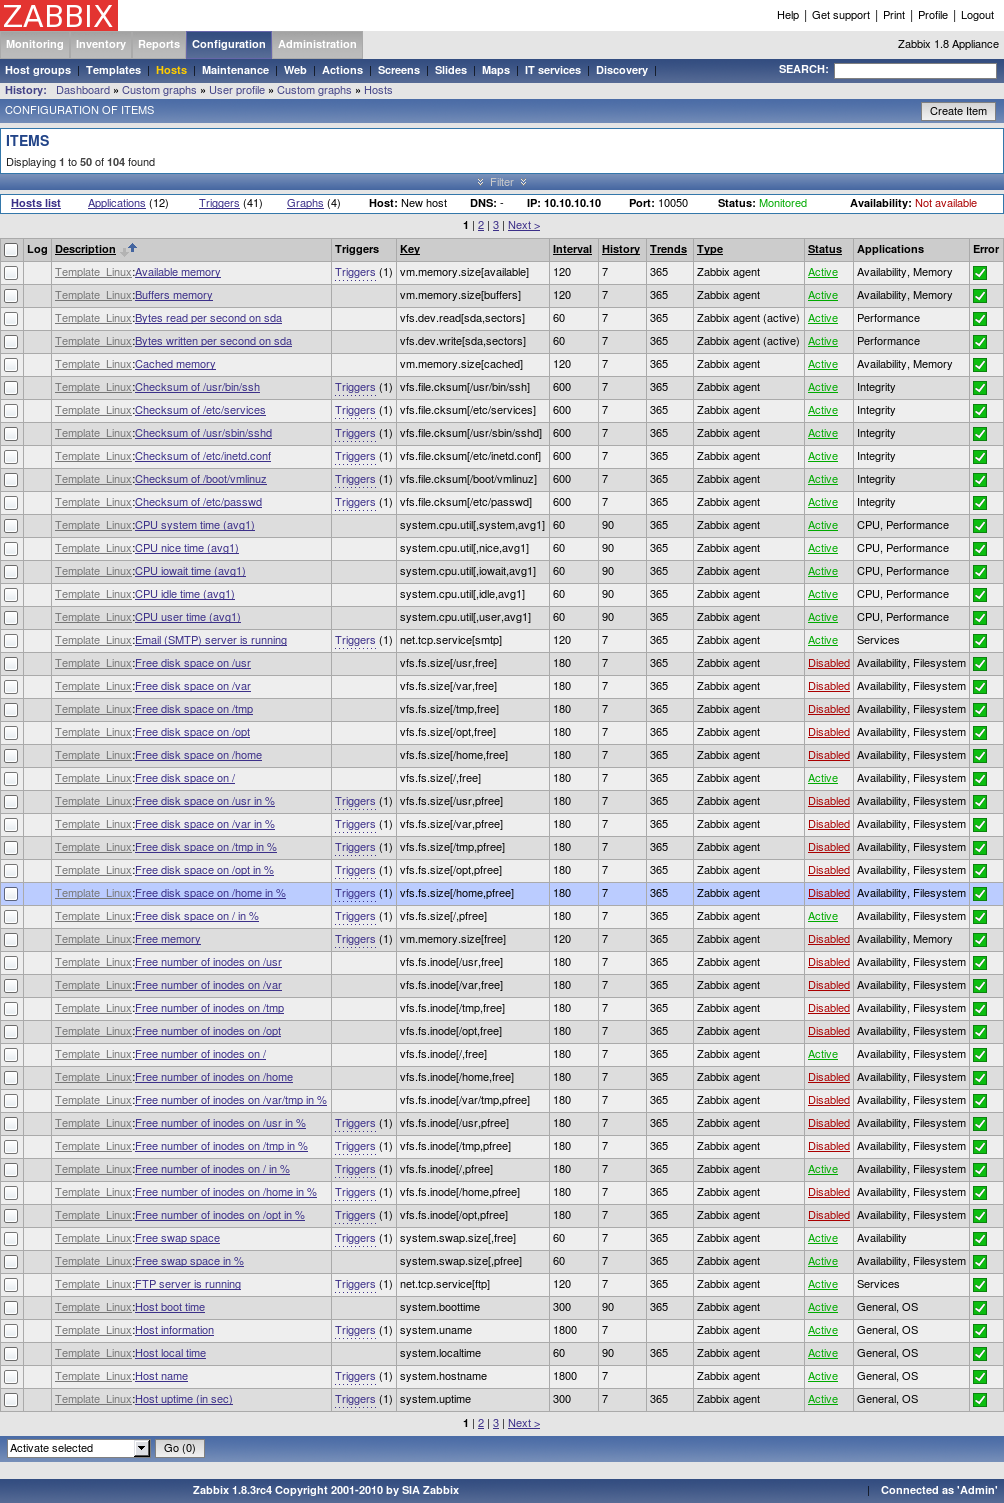
Looks like items have been added successfully. Note the Template_Linux text in gray prefixing them, which indicates which template do the entities come from. What about triggers? Looking above the item list, there's a horizontal strip which allows to easily navigate between different entity categories of a host.
By default, Zabbix entity lists are limited to 50 entries per page. you can modify this in your user profile.

In there, click on Triggers.
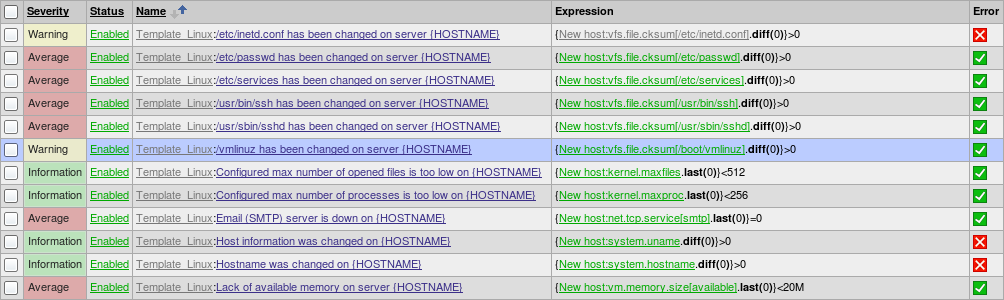
Great - triggers also seem to be in place (the above screenshot only shows part of the output, though). There was also something about graphs
- using the host bar above the trigger list navigate to custom graph configuration.
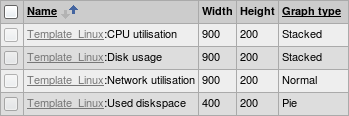
Here we can see that some templated custom graphs are available as well.
Now it is time to see what information is available. Go to Menu→Latest data and expand some category in there.
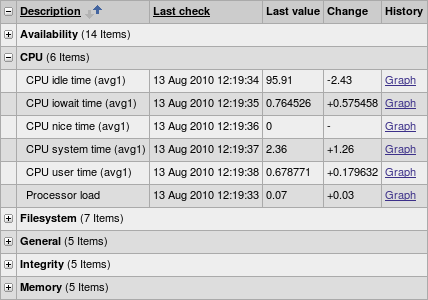
The values are being gathered and displayed along with change information, if any.
In Zabbix, for all numeric items a graph can be obtained without any configuration at all - these graphs are generated on runtime. To view such a graph, click on Graph link next to any item.
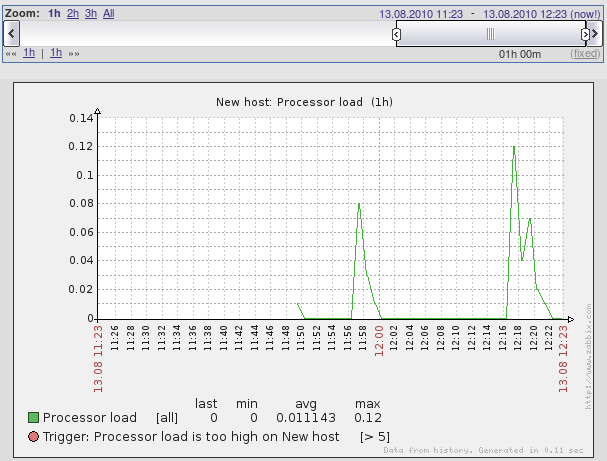
You can change the currently displayed time period using the controls above the graph.
Feel free to explore other areas that display monitoring information, including:
- Monitoring → Graphs for custom graphs;
- Monitoring → Triggers for a list of currently active problems;
- Monitoring → Dashboard for a high level overview;
- Monitoring → Maps for network maps;
- Monitoring → Screens for compound pages showing several elements at once.
After having the basic monitoring in place, we might want to actually notify on situation changes, which we'll set up in the next section.