
2 Configuration
Host groups
Configuration → Host groups
On this screen you can set up host groups and manage host group information.
A list of existing groups is displayed.
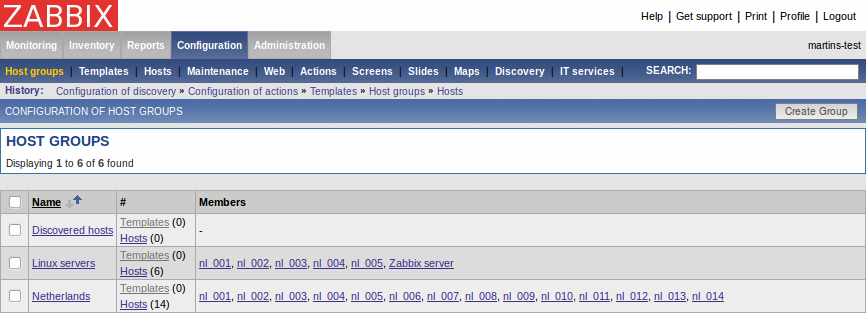
Displayed data:
| Parameter | Description |
|---|---|
| Name | Host Group name. |
| # | Number of group members (hosts). |
| Members | List of host group members. |
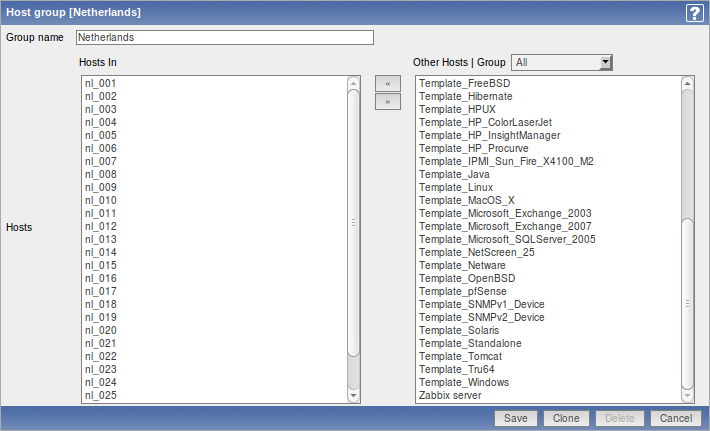
Click on Create Group in the upper right corner of the screen if you wish to add a group. If you wish to edit an existing group, click on its name in the list. A form is displayed where you can edit details of a host group.
Configuring a host group
Configuration parameters:
| Parameter | Description |
|---|---|
| Group name | Unique host group name. |
| Hosts | List of hosts, members of the group. |
Templates
Configuration → Templates
On this screen you can set up and manage host templates.
A list of existing templates is displayed.
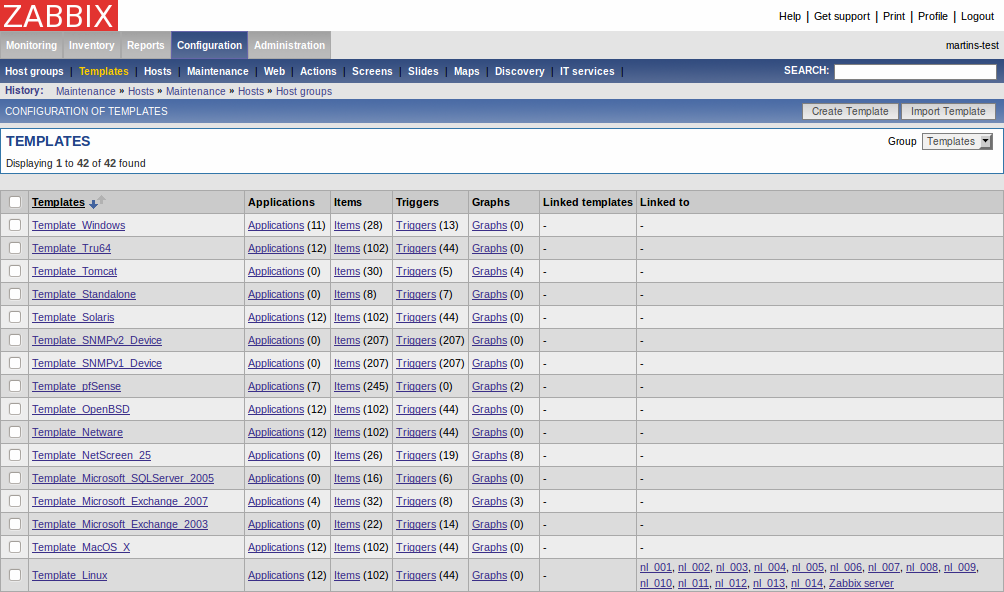
Displayed data:
| Parameter | Description |
|---|---|
| Name | Template name. |
| Templates | List of hosts linked to this template. |
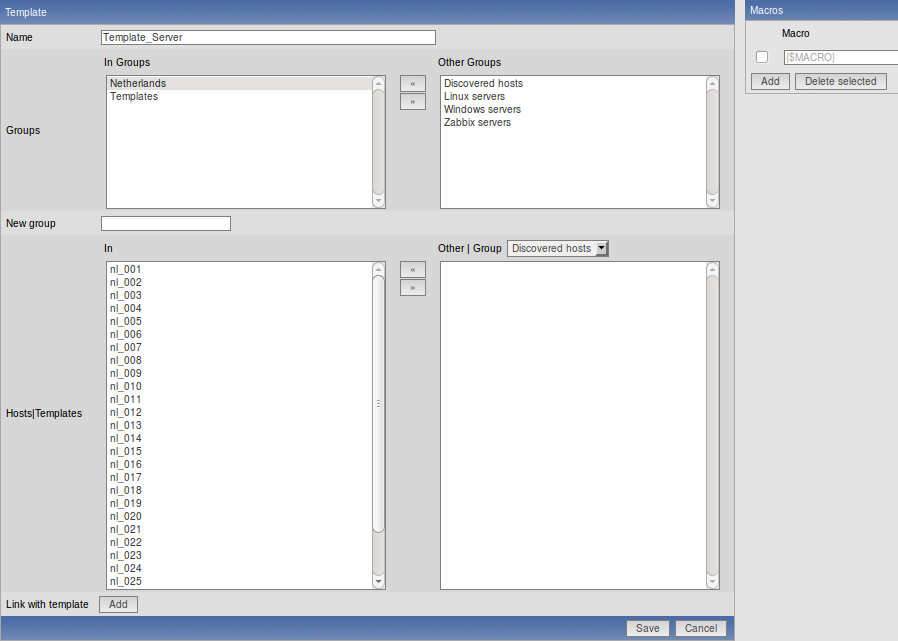
Click on Create Template in the upper right corner of the screen if you wish to add a template. If you wish to edit an existing template, click on its name in the list. A form is displayed where you can edit details of a template.
Configuring a template
Configuration parameters:
| Parameter | Description |
|---|---|
| Name | Unique template name. |
| Groups | List of host groups the template belongs to. |
| New group | New group can be created and linked to the template. Ignored, if empty. |
| Hosts/Templates | List of hosts/templates linked to the template. |
| Link with template | Link template with one or more templates. Information about items, triggers and graphs will be inherited from the templates. |
Hosts
Configuration → Hosts
On this screen you can set up hosts and manage host-related information.
A list of monitored hosts is displayed.
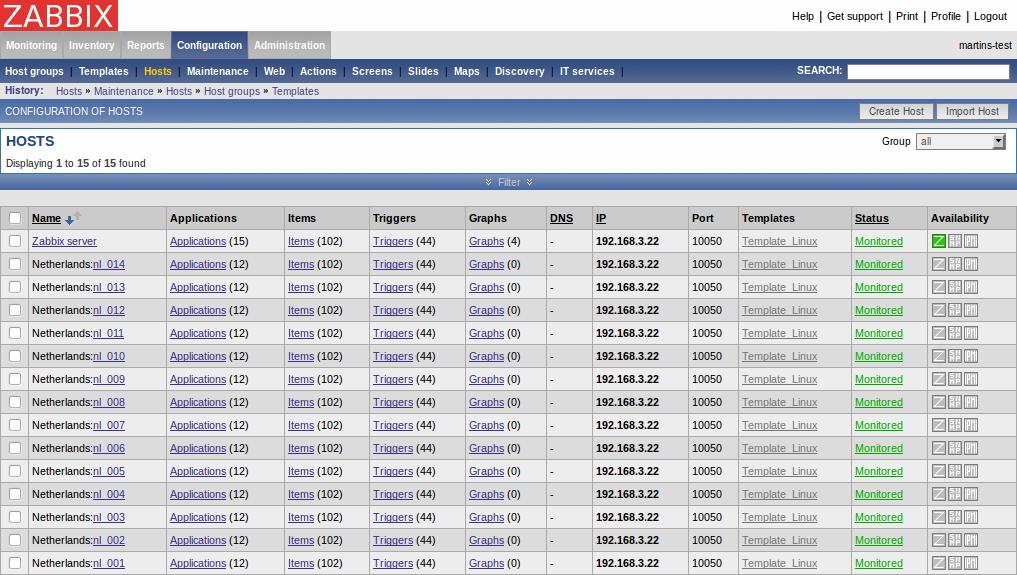
Displayed data:
| Parameter | Description |
|---|---|
| Name | Unique host name. |
| DNS | Host DNS name if used. |
| IP | Host IP address if used. |
| Port | Zabbix agent port number. Ignored if Zabbix agent items are not used. |
| Templates | List of first and second level (in parenthesis) templates linked to the host. |
| Status | Host Status: Monitored - Host is active and being monitored Disabled - Host disabled |
| Availability | Agent (Zabbix, SNMP, IPMI) availability With the default theme: green icon - agent is up and running grey icon - availability is not known red icon - agent is not available |
| Error | Any errors related to use of agent based checks. |
Click on Create Host in the upper right corner of the screen if you wish to add a host. If you wish to edit an existing host, click on its name in the host list. A form is displayed where you can edit details of a host.
Configuring a host
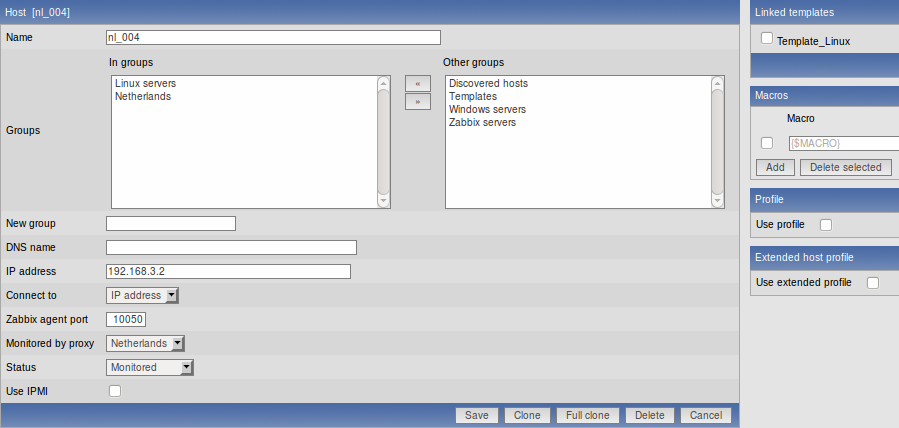
Configuration parameters:
| Parameter | Description |
|---|---|
| Name | Unique host name. |
| Groups | List of host groups the host belongs to. |
| New group | New group can be created and linked to the host. Ignored, if empty. |
| DNS name | Optional host DNS name. |
| IP address | Optional host IP address. |
| Connect to | Zabbix server will use this setting to retrieve data from agents: DNS name - Connect to host DNS name IP address - Connect to host IP (recommended) |
| Port | Zabbix agent TCP port number. Default value is 10050. |
| Monitored by proxy | The host can be monitored either by Zabbix server or one of Zabbix proxies: (no proxy) - host is monitored by Zabbix server Proxy name – host is monitored by Zabbix proxy "Proxy name" |
| Status | Host status: Monitored – Host is active, ready to be monitored Not monitored – Host is not active, thus not monitored |
| Link with template | Link host with one or more templates. Information about items, triggers and graphs will be inherited from the templates. Unlink – unlink from template, but preserve information about items, triggers and graphs Unlink and clear – unlink from template and remove all information inherited from the template |
| Use IPMI | Enable IPMI management functionality for this host. |
| IPMI IP address | IP address of IPMI management device. |
| IPMI port | Port number of the IPMI device. |
| IPMI privilege level | Keep default setting here, User. |
| IPMI username | User name for authentication. |
| IPMI password | Password for authentication. |
| Use profile | Enable or disable use of Host profile. |
| Use extended profile | Enable or disable use of extended Host profile. |
Both host and template definition forms include buttons "Clone" and "Full clone".
"Clone" will add a new host or template based on the configuration parameters of the existing host/template and that will include template linkage (thus also all templated item, trigger, graph and application information from those templates). "Full clone" in addition to that will also clone directly attached items, triggers, graphs and applications.
Note: When a new host is cloned, it will retain all template entities as they are originally on the template. Any changes to those entities made on the existing host level (changed item interval, history period) will not be cloned to the new host; instead they will be as on the template.
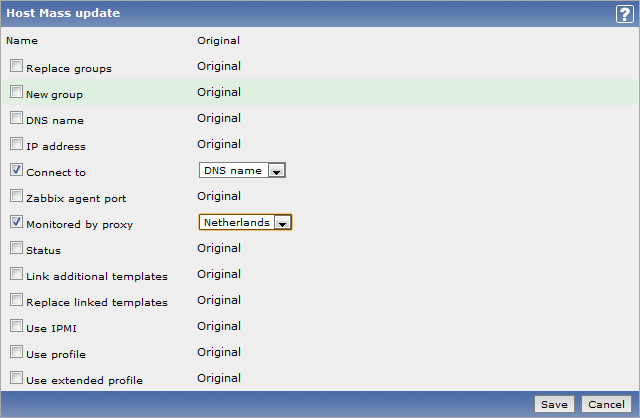
Mass-updating hosts
Mass update is a very effective way of changing attributes for a number of hosts at once.
To update some hosts, check them in the host list, then select "Mass update" in the dropdown below the host list and click on "Go". A form is displayed where you can select what attributes for the hosts you want to update.
Applications
Configuration → Hosts
Configuration → Templates
From the list of hosts or templates you can access the applications that are linked to a host or template by clicking in the Applications column.
On the applications screen you can view and manage applications.
A list of applications linked to the host/template is displayed first. To view the other existing applications, select Group/Host display options in the dropdown menus above.
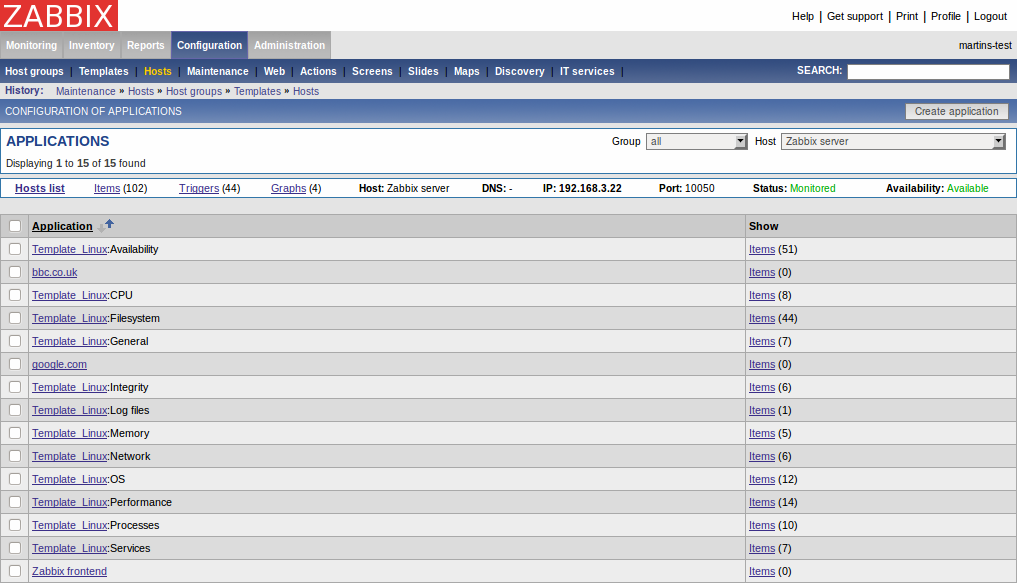
Displayed data:
| Parameter | Description |
|---|---|
| Application | Application name. |
| Show | Link to host items, also displays number of items (members of the application). |
Click on Create application in the upper right corner of the screen if you wish to add an application. If you wish to edit an existing application, click on its name in the list. A form is displayed where you can edit details of an application.
Configuring an application
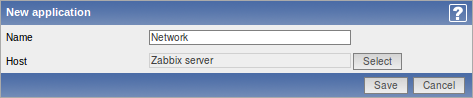
Configuration parameters:
| Parameter | Description |
|---|---|
| Name | Application name. Must be unique within one host. |
| Hosts | Host name the application is linked to. |
Items
Configuration → Hosts
Configuration → Templates
From the list of hosts or templates you can access the items that are linked to a host or template by clicking in the Items column.
On the items screen you can view and manage items.
A list of existing items is displayed.
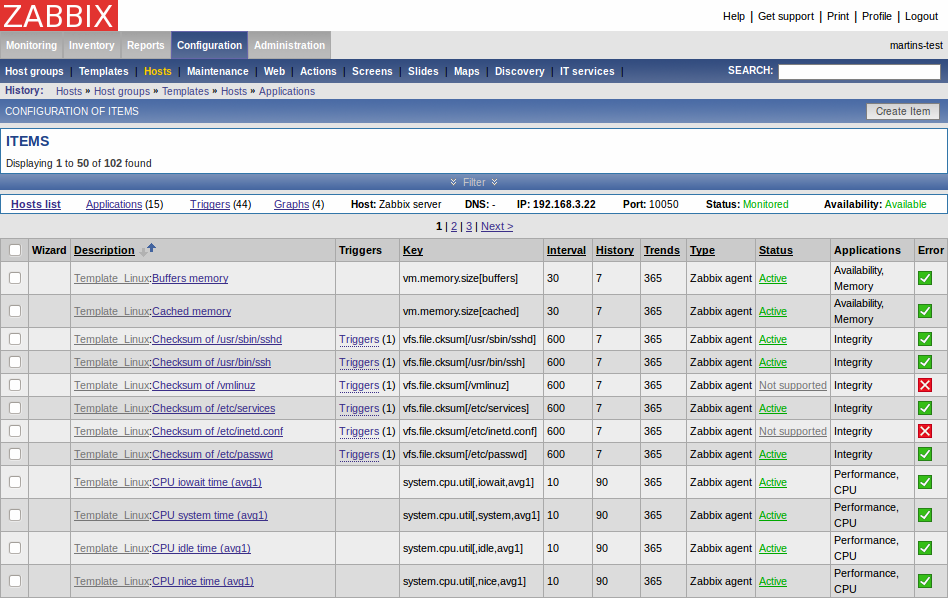
Displayed data:
| Parameter | Description |
|---|---|
| Description | Item description (name). |
| Key | Unique item key. |
| Update interval | Frequency of the check. |
| History | Number of days Zabbix keeps detailed historical data. |
| Trends | Number of days Zabbix keeps trends data. |
| Type | Item type. |
| Status | Item status. |
| Applications | List of applications the item belongs to. |
| Error | Any errors related to this item. |
Click on Create Item in the upper right corner of the screen if you wish to add an item. If you wish to edit an existing item, click on its name in the list. A form is displayed where you can edit details of an item.
Configuring an item
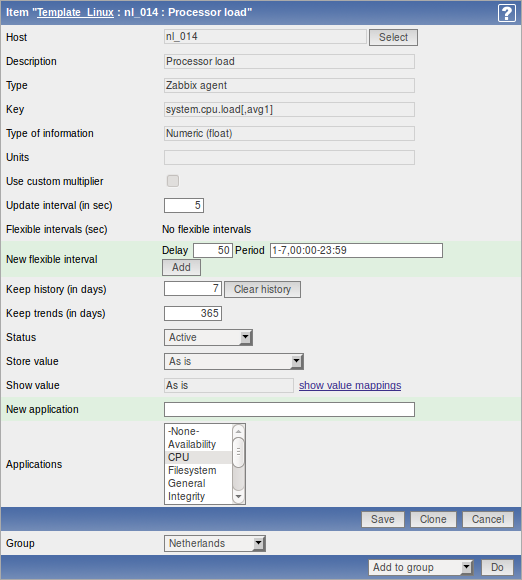
You can also create a new item from the existing one by pressing the Clone button and then saving under a different name.
Item attributes:
| Parameter | Description |
|---|---|
| Description | Item description. It may contain these macros: $1,$2...$9 - first, second... ninth parameter of item key For example: Free disk space on $1 If item key is “vfs.fs.size[/,free]”, the description will be automatically changed to "Free disk space on /" |
| Type | Item type. See sections below for detailed description of each type. |
| Key | Item key. The key must be unique within a single host. The key value must be supported by the agent or Zabbix server if key type is 'Zabbix Agent', 'Zabbix Agent (active)', 'Simple check' or 'Zabbix aggregate'. |
| Type of information | Type of data as stored in the database after performing conversions, if any. Numeric (unsigned) – 64bit unsigned integer Numeric (float) – floating point number Character – character (string) data limited to 255 bytes Log – log file. Must be set for keys log[]. Text – text of unlimited size |
| Data type | Data type is used for integer items in order to specify the expected data type: Decimal – data in decimal format Octal – data in octal format Hexadecimal – data in hexadecimal format Zabbix will automatically perform conversion to numeric. This is supported starting from version 1.8. |
| Units | If set, Zabbix will add the unit postfix to all received values. Till Zabbix 1.8.2, default multiplier is 1024, and some units have special processing: b, bps - 1000 is 1K, special processing for bits. Since Zabbix 1.8.2, default multiplier is 1000, and special processing is used for units B, where multiplier is 1024. For example, if units are set to B, Zabbix will display: 1 as 1B 1024 as 1KB 1536 as 1.5KB unixtime – translated to "yyyy.mm.dd hh:mm:ss". To translate correctly, the received value must be a Numeric (unsigned) type of information. uptime – translated to "hh:mm:ss" or "N days, hh:mm:ss" s – translated to "yyy mmm ddd hhh mmm sss ms", parameter is treated as number of seconds. Only 3 upper major units are shown, like "1m 15d 5h" or "2h 4m 46s". If there are no days to display, only two levels are displayed - "1m 5h" (no minutes, seconds or milliseconds are shown). Will be translated to "< 1 ms" if the value is less than 0.001. |
| Use multiplier | Pre-process received values. Do not use - do not pre-process received values Custom multiplier – multiply received values by value defined in Custom multiplier Use this option to convert values received in KB, MBps, etc into B, Bps. Otherwise Zabbix cannot correctly set prefixes (K, M, G etc). |
| Custom multiplier | Multiply all received value by this integer or floating-point value. |
| Update interval (in sec) | Refresh this item every N seconds. Note: If set to '0', the item will not be polled. However, if a flexible interval also exists with a non-zero value, the item will be polled during the flexible interval duration. |
| Flexible intervals | List of exceptions for Update Interval. For example: Delay: 10 Period: 1-5,09:00-18:00 – refresh set to 10 seconds for working hours. Otherwise default update interval will be used. If multiple flexible intervals overlap, the smallest Delay value is used for the overlapping period. See Time period specification page for description of Period format. Note: If set to '0', the item will not be polled during the flexible interval duration and will resume polling according to the Update interval once the flexible interval period is over. |
| Keep history (in days) | Keep detailed history for N days in the database. Older data will be removed by Housekeeper. |
| Keep trends (in days) | Keep aggregated (hourly min, max, avg, count) detailed history for N days in the database. Older data will be removed by Housekeeper. |
| Status | Active - active (normal) status. Zabbix will process this item. Disabled – item is disabled. This item will not be processed. Not supported – item is not supported by Zabbix or SNMP agent. This item will not be processed, however Zabbix may try to periodically set status of such items to Active if configured. |
| Store value | As is – no pre-processing Delta (speed per second) – evaluate value as (value-prev_value)/(time-prev_time), where value – current value value_prev – previously received value time – current timestamp prev_time – timestamp of previous value This setting is extremely useful to get speed per second based on constantly growing value. Note: If current value is smaller than the previous value, Zabbix discards that difference (stores nothing) and waits for another value. This helps to work correctly with, for instance, a wrapping (overflow) of 32-bit SNMP counters. Delta (simple change) – evaluate as (value-prev_value), where value – current value value_prev – previously received value |
| Show value | Apply value mapping to this item. Value mapping does not change received values, it is for displaying data only. It works with integer items only. For example, "Windows service states". |
| Log time format | Available for items of type Log only. Supported placeholders: * y: Year (0001-9999) * M: Month (01-12) * d: Day (01-31) * h: Hour (00-23) * m: Minute (00-59) * s: Second (00-59) Leaving this field blank means don't try to parse the timestamp. For example, consider the following line from the Zabbix agent log file: " 23480:20100328:154718.045 Zabbix Agent started. Zabbix 1.8.2 (revision 11211)." It begins with six character positions for PID, followed by date, time, and the rest of the line. Log time format for this line would be "pppppp:yyyyMMdd:hhmmss". Note that "p" and ":" chars are just placeholders and can be anything but "yMdhms". |
| Applications | Link item to one or more applications. |
Up to version 1.8.1 Zabbix supports the following unit prefixes:
- K (Kilo);
- M (Mega);
- G (Giga);
- T (Tera);
Since version 1.8.2, additionally supported prefixes include:
- P (Peta);
- E (Exa);
- Z (Zetta);
- Y (Yotta);
See more details about items in other sections of the Manual.
** Unit blacklist **
By default, specifying a unit for an item will result in multiplier prefix being added - for example, value 2048 with unit B would be displayed as 2KB. For a pre-defined, hardcoded list of units this is prevented:
- ms
- RPM
- rpm
- %
Note that both lowercase and uppercase rpm (rpm and RPM) strings are blacklisted.
Mass-updating items
Mass update is a very effective way of changing attributes for a number of items at once.
To update some items, check them in the item list, then select "Mass update" in the dropdown below the item list and click on "Go". A form is displayed where you can select what attributes for the items you want to update.
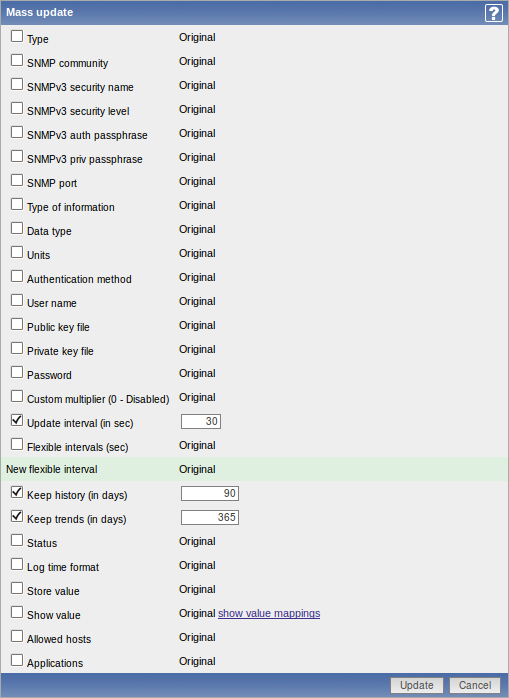
Check any parameter that you would like to change, enter a new value for it and press "Save".
Copy selected to...
The function makes it possible to copy a selected item to a number of hosts.
To do so, mark the item in the list, then select "Copy selected to..." in the dropdown below the list and click on "Go". A form is displayed where you can select the hosts to copy items to.
Select the hosts you would like to copy the items to and press "Copy".
Triggers
Configuration → Hosts
Configuration → Templates
From the list of hosts or templates you can access the triggers that are linked to a host or template by clicking in the Triggers column.
On the triggers screen you can view and manage triggers.
A list of existing triggers is displayed.
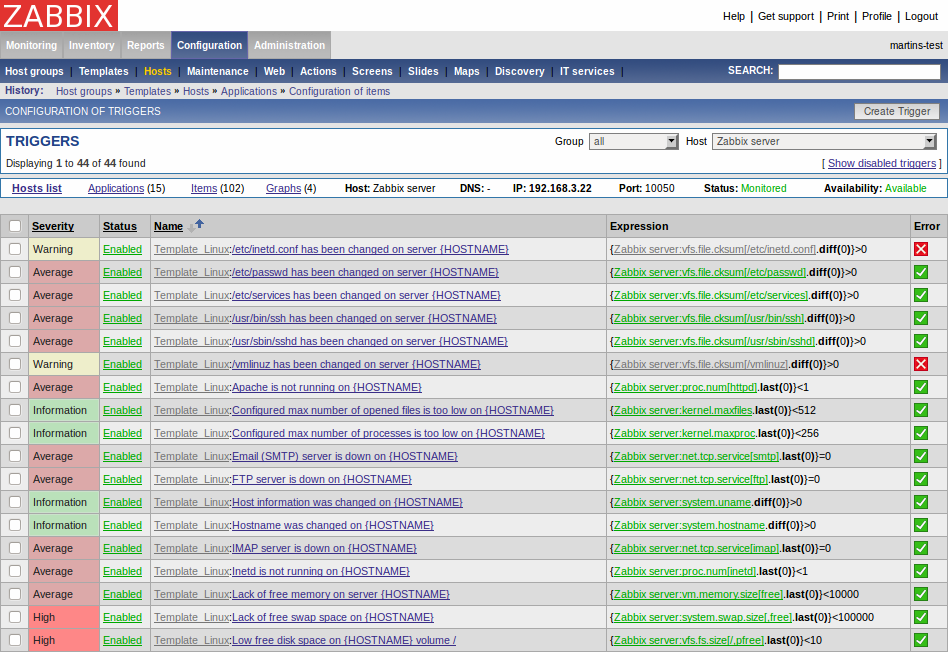
Displayed data:
| Parameter | Description |
|---|---|
| Severity | Coloured trigger severity. |
| Status | Trigger status. Note that Disabled triggers are hidden by default. |
| Name | Trigger name. |
| Expression | Trigger expression. |
Click on Create Trigger in the upper right corner of the screen if you wish to add a trigger. If you wish to edit an existing trigger, click on its name in the list. A form is displayed where you can edit details of a trigger.
Configuring a trigger
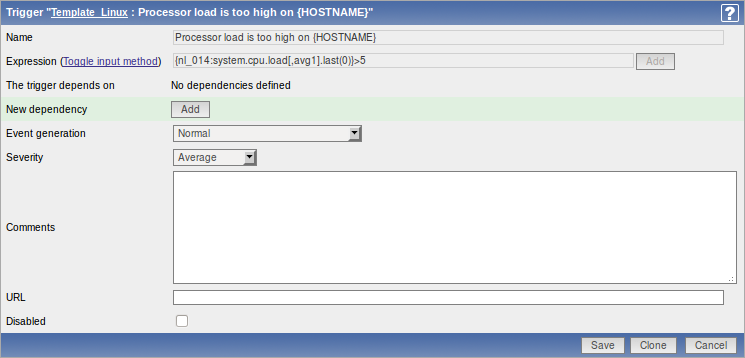
You can also create a new trigger from the existing one by pressing the Clone button and then saving under a different name.
Trigger attributes:
| Parameter | Description |
|---|---|
| Name | Trigger name. The name may contain macros. |
| Expression | Logical expression used for calculation of trigger state. |
| The trigger depends on | List of triggers the trigger depends on. |
| New dependency | Add new dependency. |
| Event generation | Normal – events are generated normally, on trigger status change Normal + Multiple PROBLEM events (Multiple TRUE events in 1.8.2 and before) – events are also generated on every PROBLEM evaluation of the trigger |
| Severity | Trigger severity. |
| Comments | Text field used to provide more information about this trigger. May contain instructions for fixing specific problem, contact detail of responsible staff, etc. |
| URL | If not empty, the URL is used in the screen 'Status of Triggers'. |
| Disabled | Trigger can be disabled if required. |
See also more information about triggers.
Mass-updating triggers
Mass update is a very effective way of changing attributes for a number of triggers at once.
To update some triggers, check them in the list, then select "Mass update" in the dropdown below the trigger list and click on "Go". A form is displayed where you can select what attributes for the triggers you want to update.
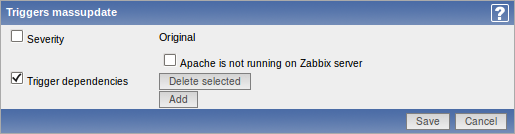
Check any parameter that you would like to change, enter a new value for it and press "Save".
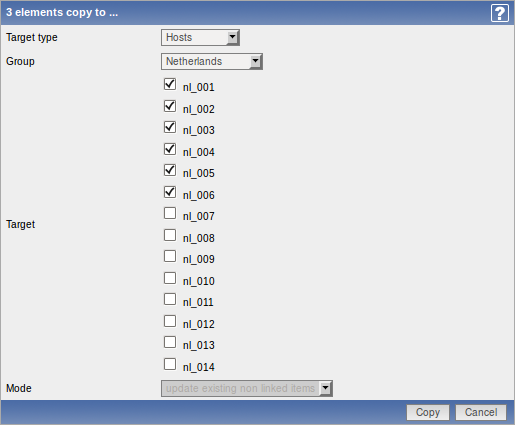
Copy selected to...
The function makes it possible to copy a selected trigger to a number of hosts.
To do so, mark the trigger in the list, then select "Copy selected to..." in the dropdown below the list and click on "Go". A form is displayed where you can select the hosts to copy triggers to.
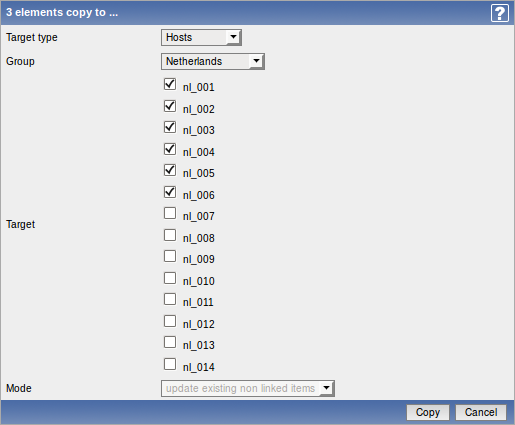
Select the hosts you would like to copy triggers to and press "Copy".
Graphs
Configuration → Hosts
Configuration → Templates
From the list of hosts or templates you can access the graphs that are linked to a host or template by clicking in the Graphs column.
On the graphs screen you can manage custom graphs.
A list of existing custom graphs is displayed.
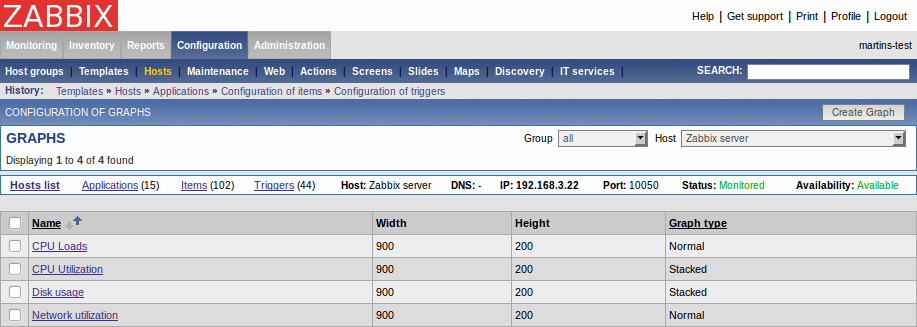
Displayed data:
| Parameter | Description |
|---|---|
| Name | Graph name. |
| Width | Graph width in pixels. |
| Height | Graph height in pixels. |
| Graph type | Graph type: Normal Stacked Pie Exploded |
Configuring a graph
Click on Create Graph in the upper right corner of the screen in the graph list if you wish to add a graph. If you wish to edit an existing graph, click on its name in the list. A form is displayed where you can configure a graph.
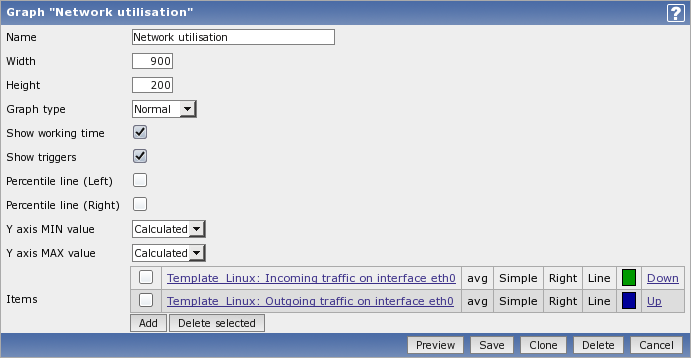
You can also create a new graph from the existing one by pressing the Clone button and then saving under a different name.
Graph attributes:
| Parameter | Description |
|---|---|
| Name | Unique graph name. |
| Width | Graph width in pixels. |
| Height | Graph height in pixels. |
| Graph type | Graph type: Normal – normal graph, values displayed as lines. Stacked – stacked graph. Pie – pie graphs. Exploded – exploded pie graph. |
| Show working time | If selected, non-working hours will be shown with gray background. Not available for pie and exploded pie graphs. |
| Show triggers | If selected, simple triggers will be displayed as red lines. Not available for pie and exploded pie graphs. |
| Percentile line (Left) | Display percentile for left Y axis. Normally used for displaying 95% percentile. Only available for normal graphs. |
| Percentile line (Right) | Display percentile for right Y axis. Normally used for displaying 95% percentile. Only available for normal graphs. |
| Y axis MIN value | Type of Y axis: Calculated – Y axis value will be automatically calculated Calculated [min=0] – Y min value is set to 0, maximum value will be automatically calculated. Fixed – fixed min and max value for Y axis. Not available for pie and exploded pie graphs. |
| Y axis MAX value | Type of Y axis: Calculated – Y axis value will be automatically calculated Calculated [min=0] – Y min value is set to 0, maximum value will be automatically calculated. Fixed – fixed min and max value for Y axis. Not available for pie and exploded pie graphs. |
| 3D view | Enable 3D style. For pie and exploded pie graphs only. |
| Legend | Display legend. For pie and exploded pie graphs only. |
| Items | List of graph elements (items) to be displayed for this graph. |
Graph element:
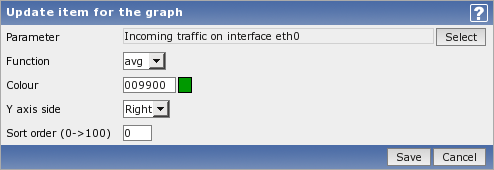
Attributes of a graph element:
| Parameter | Description |
|---|---|
| Parameter | Selection of host item, which will be displayed. |
| Type | Type (only available for normal graphs): Simple Aggregated |
| Function | What values will be displayed when more than one value exists for a single pixel (X-coordinate): all – all (minimum, average and maximum) min – minimum only avg – average only max – maximum only |
| Draw style | Draw style (only available for normal graphs; for stacked graphs filled region is always used): Line – draw lines Filled region – draw filled region Bold line – draw bold lines Dot – draw dots Dashed line – draw dashed line |
| Colour | RGB colour in HEX notation. |
| Aggregated periods count | |
| Y axis side | Which Y axis side the element is assigned to. |
| Sort order (0→100) | Draw order, 0 will be processed first. |
Below the graph preview is displayed. Note that it will not show any data for template items.
3 triggers is the hard-coded limit for the number of triggers displayed in the graph legend.
Template linkage
Starting with Zabbix 1.8, template linkage to hosts can be managed in Configuration→Templates.
Proxies
Starting with Zabbix 1.8, proxy management is available at Administration→DM.
Web monitoring
Configuration → Web
On this screen you can manage scenarios for web monitoring.
A list of the active scenarios is displayed.
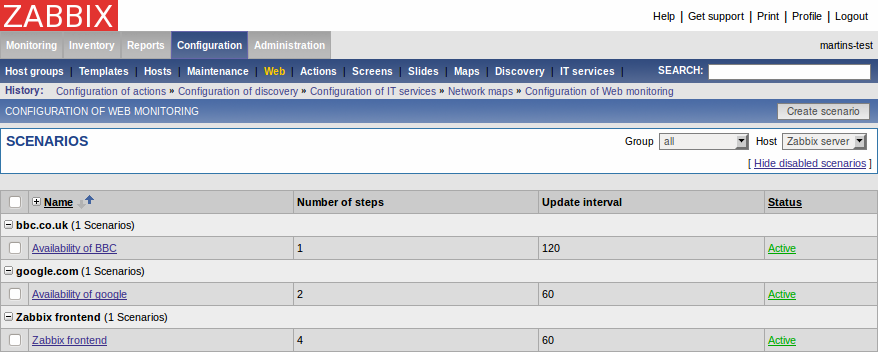
Displayed data:
| Parameter | Description |
|---|---|
| Name | Unique name of the web scenario. |
| Number of steps | Number of individual steps (HTTP requests) the scenario consists of. |
| Update interval | Frequency of execution of the web scenario. |
| Status | Status of the scenario: Active - the scenario is active Disabled - the scenario is disabled. Note that disabled scenarios are not displayed by default in the main screen. |
Click on Create scenario in the upper right corner of the screen if you wish to add a scenario. If you wish to edit an existing scenario, click on its name in the list. A form is displayed where you can edit the parameters of a web scenario.
Configuring a web scenario
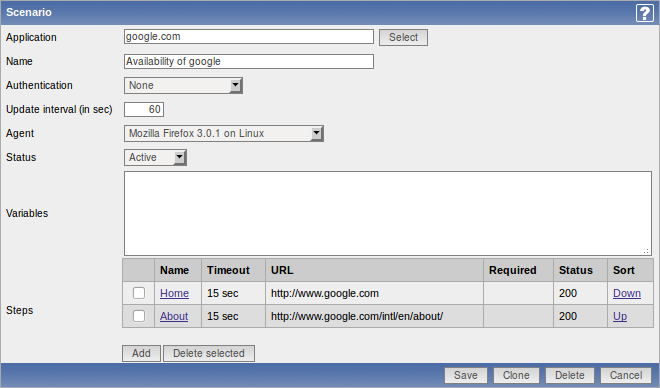
Configuration parameters:
| Parameter | Description |
|---|---|
| Application | Host application the scenario is linked to. |
| Name | Unique name of the web scenario. |
| Update interval (in sec) | Frequency of execution of the web scenario. |
| Agent | Client agent string. Zabbix will pretend that it is Firefox, MS Explorer or any other application. Useful when a website returns different content for different browsers. |
| Status | Status of the scenario: Active - the scenario is active Disabled - the scenario is disabled. Note that disabled scenarios are not displayed by default in the main screen. |
| Variables | List of variables (macros) to be used in scenario steps (URL and Post variables). They have the following format: {macro1}=value1 {macro2}=value2 For example: username=Alexei password=kj3h5kJ34bd The macros can be referenced as {username} and {password}. Zabbix will automatically replace them with actual values. |
| Steps | List of steps executed by the scenario, displaying: Name - step name Timeout - timeout URL - location to connect to Required - required string Status - step status |
To add a web scenario step, click on the Add button next to Steps. A form will open where you can define the parameters of an individual web scenario step.
Configuring a web scenario step
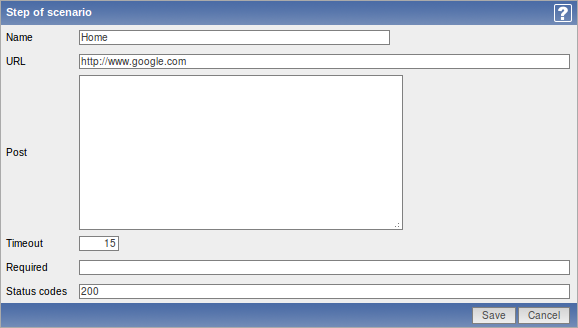
Configuration parameters:
| Parameter | Description |
|---|---|
| Name | Unique step name. |
| URL | URL to connect to and retrieve data. For example: http://www.zabbix.com https://www.google.com |
| Post | List of POST variables. GET variables can be passed in the URL parameter. |
| Timeout | Zabbix will not spend more than the set amount of seconds on processing the URL. |
| Required | Required string. Retrieved content (HTML) must contain this string, otherwise the step will fail. If empty, no check is performed. |
| Status codes | List of expected HTTP codes. If Zabbix gets a code which is not in the list, the step will fail. If empty, no check is performed. For example: 200,201,210-299 |
See also this section for more information about web monitoring.
Actions
Configuration → Actions
On this screen you can set up and manage actions.
A list of existing actions is displayed. Actions are displayed by the event source: Triggers/Discovery/Auto registration. Use the dropdown menu in the upper right corner to switch between various sources.
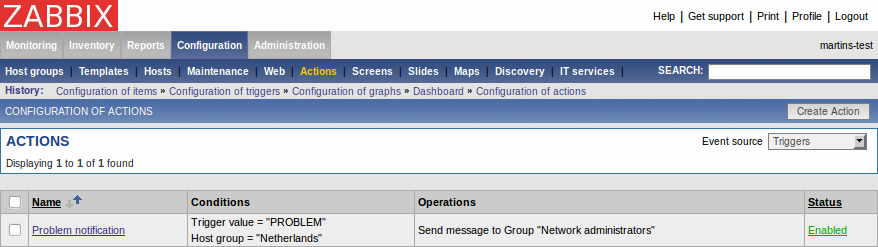
Displayed data:
| Parameter | Description |
|---|---|
| Name | Action name. |
| Conditions | List of conditions for this action. |
| Operations | List of operations for execution. |
| Status | Status of the action. |
Click on Create Action in the upper right corner of the screen if you wish to add an action. If you wish to edit an existing action, click on its name in the host list. A form is displayed where you can edit details of an action.
Configuring an action
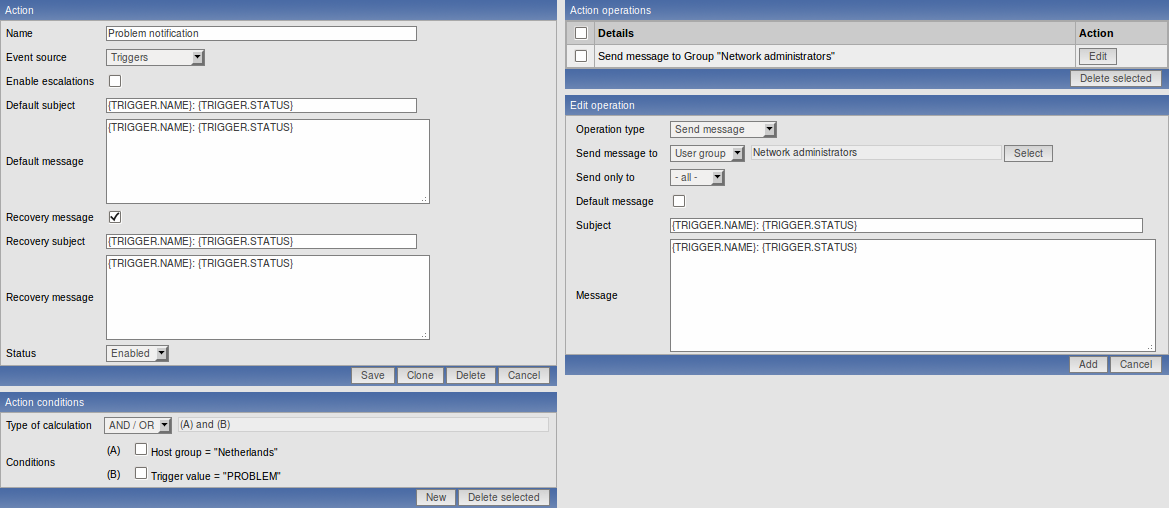
More configuration options are available if escalation is enabled:
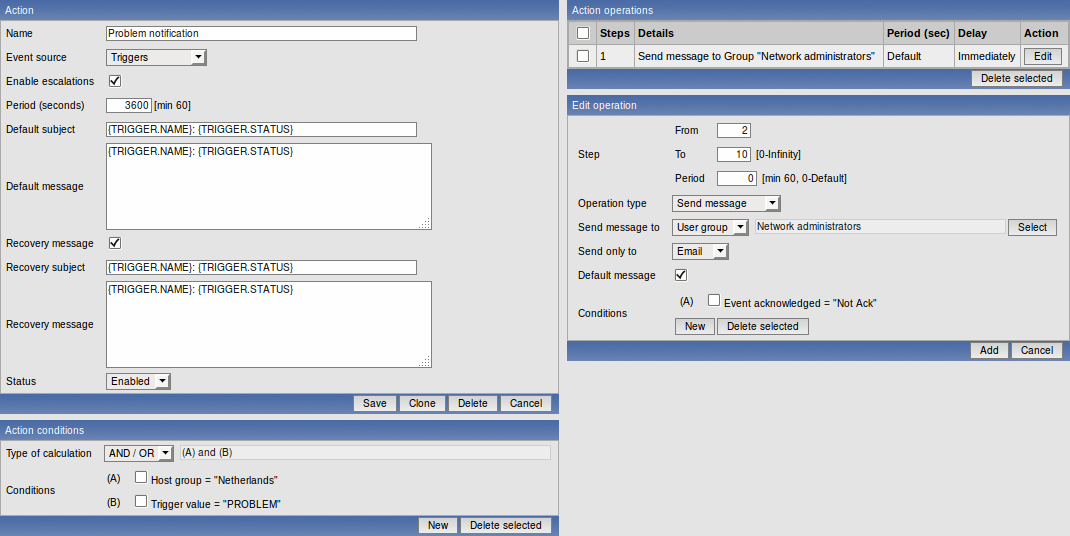
See more details about configuration of actions, conditions and operations in other sections of the Manual.
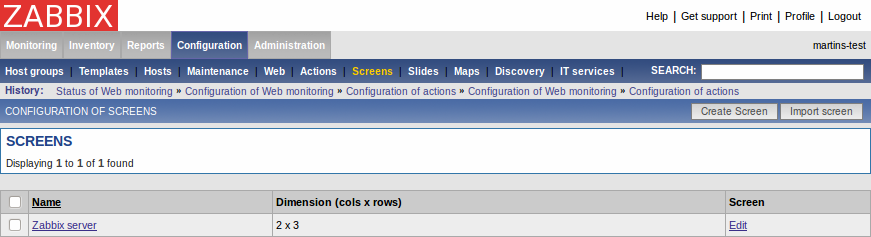
Screens
Configuration → Screens
On this screen you can set up and manage screens.
A list of existing screens is displayed.
| Parameter | Description |
|---|---|
| Name | Screen name. |
| Dimension (cols x rows) | Screen size, number of columns and rows. |
Click on Create Screen in the upper right corner of the screen if you wish to add a screen. If you wish to edit the elements of an existing screen, click on its name in the list. If you wish to edit high-level information of an existing screen, click on the Edit button. A form is displayed where you can edit a screen.
Configuring a screen (high-level)
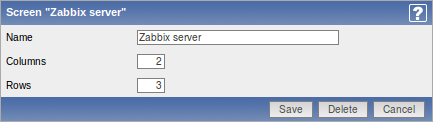
Screen high-level attributes:
| Parameter | Description |
|---|---|
| Name | Unique screen name. |
| Columns | Number of columns in the screen. |
| Rows | Number of rows in the screen. |
Configuring screen elements
You can configure what will be displayed in each element (cell) of a screen.
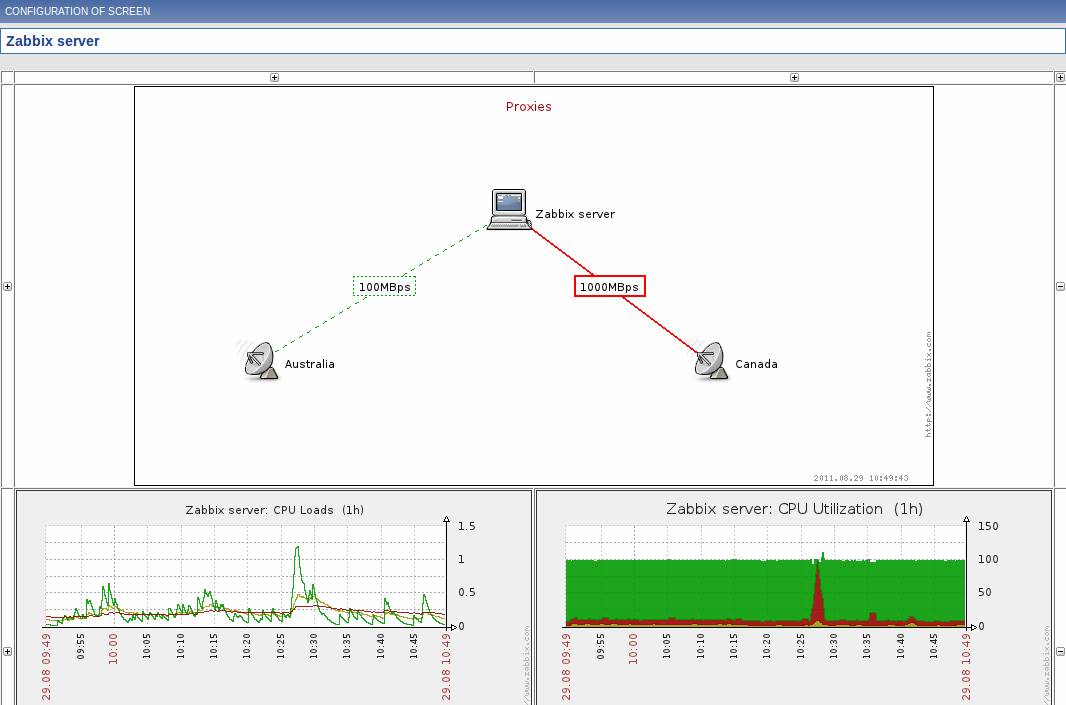
Click on a screen element (cell) and a form will be displayed where you can edit the attributes of an element.
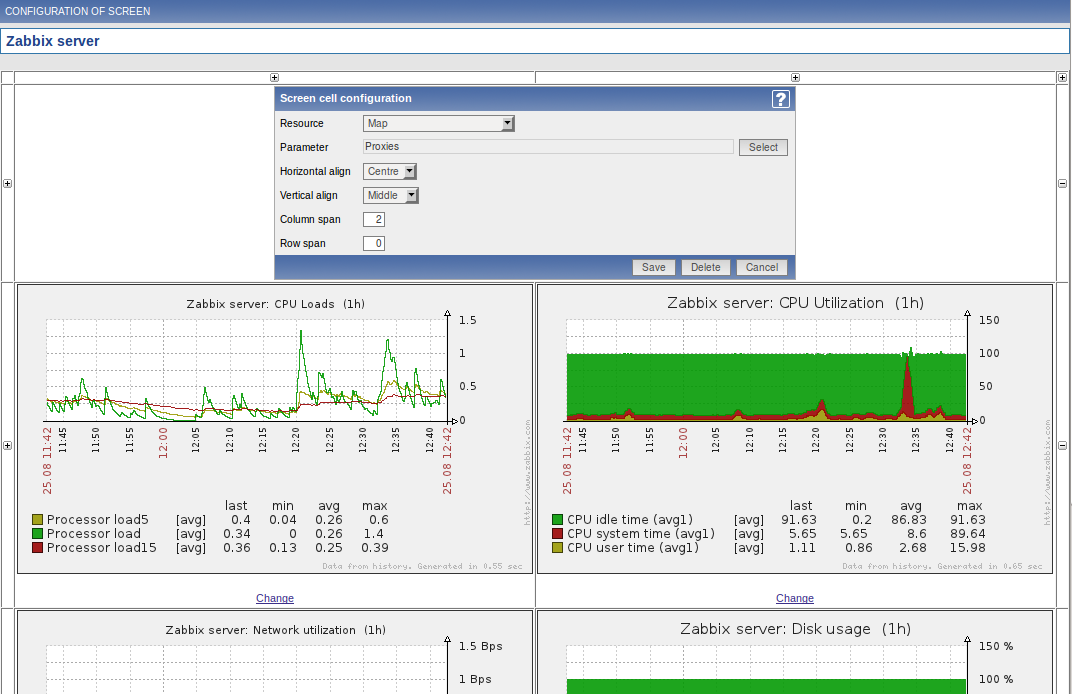
Screen element attributes:
| Parameter | Description |
|---|---|
| Resource | Information displayed in the cell: Clock – digital or analog clock displaying current server or local time Data overview – latest data for a group of hosts Graph – single custom graph History of actions – history of recent actions History of events – latest events Hosts info – high level host related information Map – single map Plain text – plain text data Screen – screen (one screen may contain other screens inside) Server info – server high-level information Simple graph – single simple graph Triggers info – high level trigger related information Triggers overview - status of triggers for a host group URL – include content from an external resource |
| Horizontal align | Possible values: Center Left Right |
| Vertical align | Possible values: Middle Top Bottom |
| Column span | Extend cell to a number of columns, same way as HTML column spanning works. |
| Row span | Extend cell to a number of rows, same way as HTML row spanning works. |
Dynamic elements
For some of the elements there is an extra option called Dynamic item. Checking this box at first does not to seem to change anything.
However, once you go to Monitoring → Screens, you may realize that now you have extra dropdowns there for selecting the host. Thus you have a screen where some elements display the same information while others display information depending on the currently selected host.
The benefit of this is that you do not need to create extra screens just because you want to see the same graphs containing data from various hosts.
Dynamic item option is available for several screen elements:
- Graphs (custom graphs)
- Simple graphs
- Plain text
Clicking on a dynamic graph opens it in full view; although with custom graphs that is supported with the default host selected only.
Maps
Configuration → Maps
On this screen you can manage user-defined maps.
A list of existing maps is displayed.
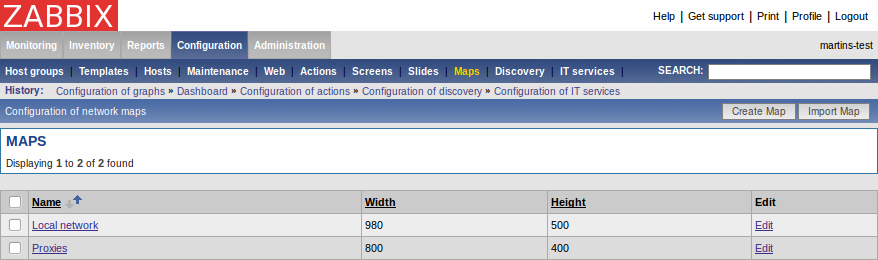
Displayed data:
| Parameter | Description |
|---|---|
| Name | Map name |
| Width | Map width in pixels. |
| Height | Map height in pixels. |
Click on Create Map in the upper right corner of the screen if you wish to add a map. If you wish to edit the elements of an existing map, click on its name in the list. If you wish to edit high-level information of an existing map, click on the Edit button. A form is displayed where you can configure a user-defined map.
Configuring a map (high-level)
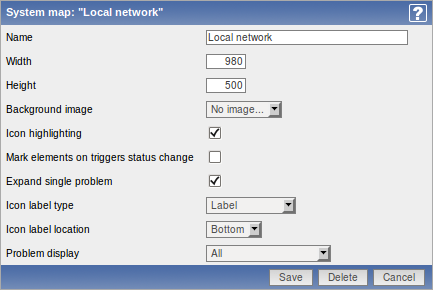
Map high-level attributes:
| Parameter | Description |
|---|---|
| Name | Unique map name. |
| Width | Map width in pixels. |
| Height | Map height in pixels. |
| Background image | Use background image: No image - no background image (white background) Image - selected image to be used as a background image. No scaling is performed. |
| Icon highlighting | Map elements will receive highlighting. If element has an active trigger, round background will be used, having same colour as the highest severity trigger. If element status is "disabled" or "in maintenance", square background will be used. This option is available since Zabbix 1.8. |
| Mark elements on trigger status change | Elements that have a trigger status recently changed will be highlighted with markers. This option is available since Zabbix 1.8.3. |
| Expand single problem | If a map element (host, host group or another map) has a single problem, this option controls whether problem (trigger) name is printed, or problem count. If marked, problem name is used. This option is available since Zabbix 1.8.1. For upgrades from previous installations it is enabled by default on all maps. |
| Icon label type | Label type used for all map icons: Label - icon label only IP address - IP address only Element name - element name (for example, host name) Status only - status only (OK or PROBLEM) Nothing - no icon labels are displayed |
| Icon label location | Display icon label on: Bottom - bottom (under the icon) Left - left side Right - right side Top - top of the icon |
Configuring a map element
To add an element to the map, click on the "+" next to Icon. The new element will appear at the top left corner of the map. Now you can drag and drop it on a desired place on the map. By clicking on the element, a form is displayed where you can edit the attributes of the element - its type, label, icon type etc.
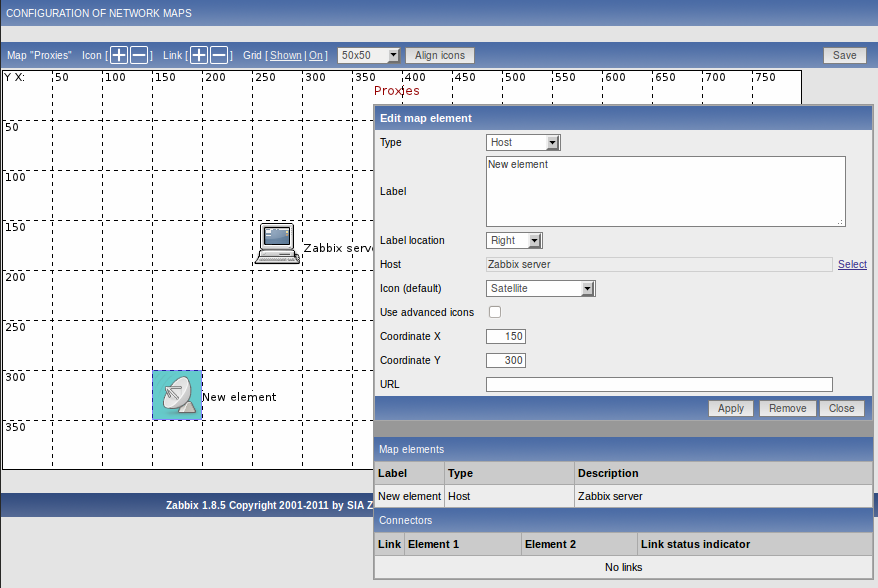
Map element attributes:
| Parameter | Description |
|---|---|
| Type | Type of the element: Host - icon representing status of all triggers of the selected host Map - icon representing status of all elements of a map Trigger - icon representing status of a single trigger Host group - icon representing status of all triggers of all hosts belonging to Image - an icon, not linked to any resource |
| Label | Icon label, any string. Macros and multi-line string can be used in labels starting from version 1.8 |
| Label location | Label location: Default - Map's default label location Bottom - bottom (under the icon) Left - left side Right - right side Top - top of the icon |
| Host | Status of triggers for the selected host will be used. |
| Map | Status of all elements for the selected map will be used. |
| Trigger | Status of the selected trigger will be used. |
| Host group | Status of all triggers for the selected host group will be used. |
| Icon (ok) | Icon to be used when no problem exists. |
| Icon (problem) | Icon to be used in case of problems (one or more). |
| Icon (unknown) | Icon to be used if the selected host is in an unknown state. |
| Icon (disabled) | Icon to be used if the selected host is disabled. |
| Coordinate X | X coordinate for the map element. |
| Coordinate Y | Y coordinate for the map element. |
| URL | If set, the URL will be used when a user clicks on the screen element. |
Configuring a link
To link two elements in the map, select them both and click on the "+" next to Link. A form is displayed where you can click on the respective link and edit its attributes.
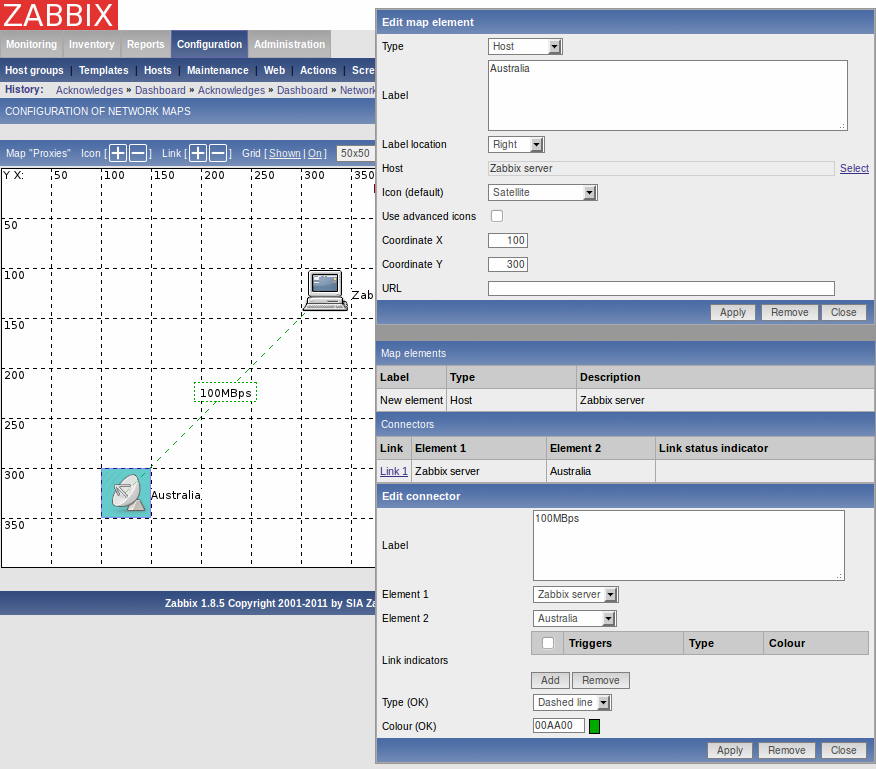
Map link attributes:
| Parameter | Description |
|---|---|
| Label | Label that will be rendered on top of the link. You can use macros here. |
| Element 1 | First element that link connects. |
| Element 2 | Second element that link connects. |
| Link status indicators | List of triggers linked to the link. In case if a trigger has status PROBLEM, its style is applied to the link. |
| Type (OK) | Default link style: Line - single line Bold line - bold line Dot - dots Dashed line - dashed line |
| Colour (OK) | Default link colour. |
Discovery
Configuration → Discovery
On this screen you can manage discovery rules.
A list of existing discovery rules is displayed.
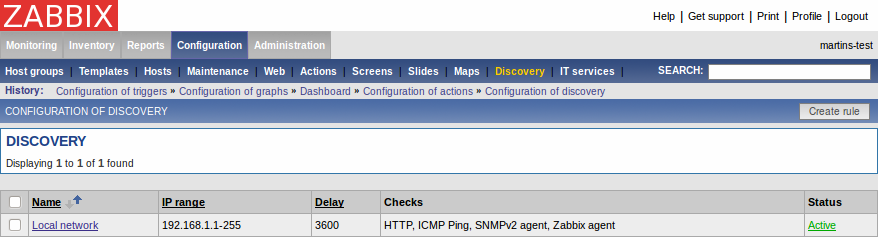
Displayed data:
| Parameter | Description |
|---|---|
| Name | Name of discovery rule. |
| IP range | Range of IP addresses affected by the discovery rule. |
| Delay | Frequency in seconds. |
| Checks | List of checks executed by the discovery rule. |
| Status | Status of the discovery rule: Active - the rule is active Disabled - the rule is disabled |
Click on Create rule in the upper right corner of the screen if you wish to add a discovery rule. If you wish to edit an existing discovery rule, click on its name in the list. A form is displayed where you can edit the parameters of a discovery rule.
Configuring a discovery rule
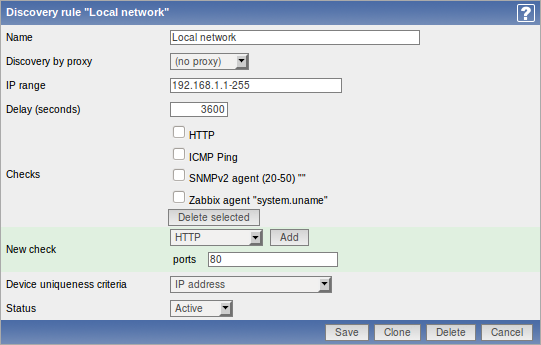
Discovery rule attributes:
| Parameter | Description |
|---|---|
| Name | Unique name of the discovery rule. |
| Discovery by proxy | Who performs discovery: (no proxy) - Zabbix server is doing discovery proxy name - This proxy performs discovery |
| IP range | Range of IP addresses for discovery. Format: Single IP: 192.168.1.33 Range of IP addresses: 192.168.1.1-255 List: 192.168.1.1-255,192.168.2.1-100,192.168.2.200 CIDR notation: 192.168.1.0/24 |
| Delay (seconds) | This parameter defines how often Zabbix should execute this rule in seconds. |
| Checks | List of supported checks: SSH, LDAP, SMTP, FTP, HTTP, POP, NNTP, IMAP, TCP, Zabbix agent, SNMPv1 agent, SNMPv2 agent, SNMPv3 agent, ICMP ping Port range may be: single port (22), a range of ports (22-45) or a list (22-45,55,60-70) |
| Device uniqueness criteria | If Zabbix will discover another device for which value, retrieved from the check that is specified as Device uniqueness criteria, it will be considered to be already discovered and new host will not be added |
| Status | Status of the discovery rule: Active - the rule is active Disabled - the rule is disabled |
IT Services
Configuration → IT Services
On this screen you can manage IT Services.
A list of existing IT Services is displayed.
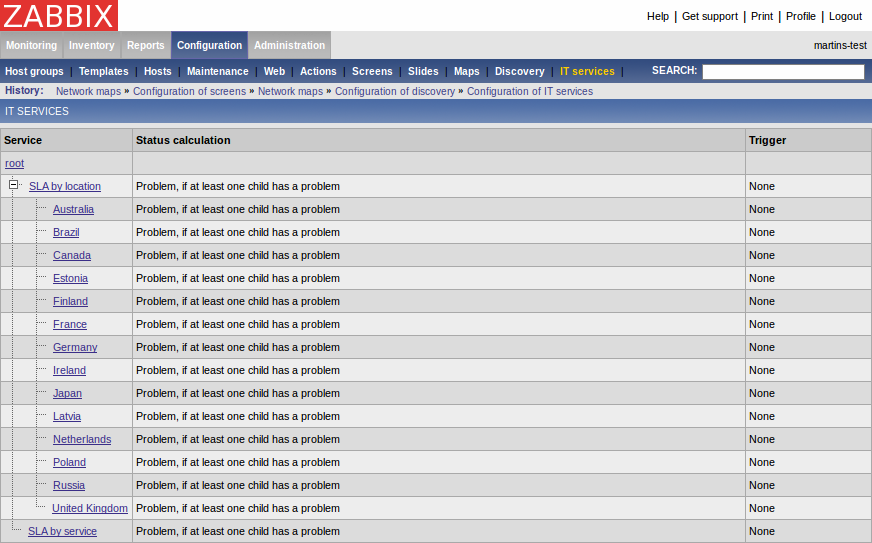
Displayed data:
| Parameter | Description |
|---|---|
| Service | Service name. |
| Status calculation | How the service updates its status. |
| Trigger | Linked to a trigger: none - no linkage trigger name - linked to the trigger, thus depends on the trigger status |
Configuring an IT Service
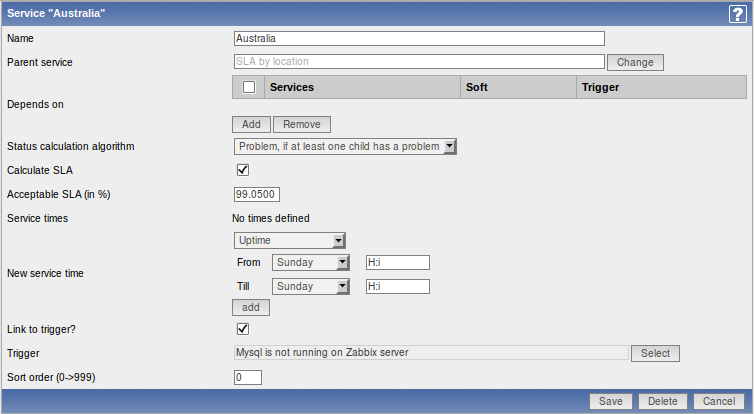
IT Service attributes:
| Parameter | Description |
|---|---|
| Name | Service name. |
| Parent service | Parent service. For reference only, it cannot be changed. |
| Depends on | List of child services the service depends on. |
| Status calculation algorithm | How to calculate status of the service: Do not calculate - do not calculate service status Problem, if it least one child has a problem - considered to be a problem if at least one child service has a problem Problem, if all children have problems - considered to be a problem if all child services have problems |
| Calculate SLA | Select to display SLA data. |
| Acceptable SLA (in %) | SLA percentage for this service. It is used for reporting. |
| Service times | By default, all services are expected to operate 24x7x365. Add new service times to make exceptions. |
| New service time | Service times: One-time downtime - a single downtime. Service state within this period does not affect SLA. Uptime - service uptime Downtime - Service state within this period does not affect SLA. |
| Link to trigger | Services of the lowest level must be linked to triggers. |
| Sort order | Display sort order, lowest comes first. |
Export/Import
Starting with Zabbix 1.8.3, this section has been removed. Import and export controls now are available in corresponding configuration pages (hosts, templates, maps or screens).
Export
The screen is used to export hosts, items, triggers and graphs.
Export
The screen provides list of hosts and their elements for export.
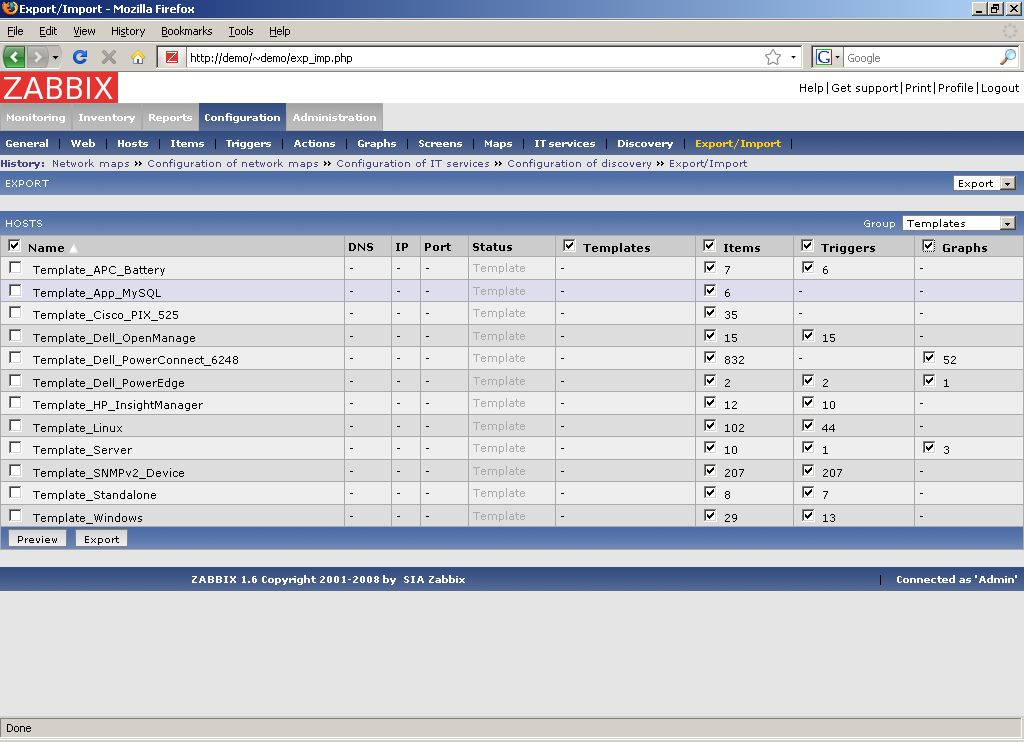
Select elements you would like to export, then press "Preview" or "Export".
Displayed data:
| Parameter | Description |
|---|---|
| Name | Host name. |
| DNS | Host DNS name. |
| IP | IP address of Zabbix agent. |
| Port | Zabbix agent port number. |
| Status | Host status. |
| Templates | Select to export template related information. |
| Items | Select to export host items. |
| Triggers | Select to export host triggers. |
| Graphs | Select to export host graphs. |
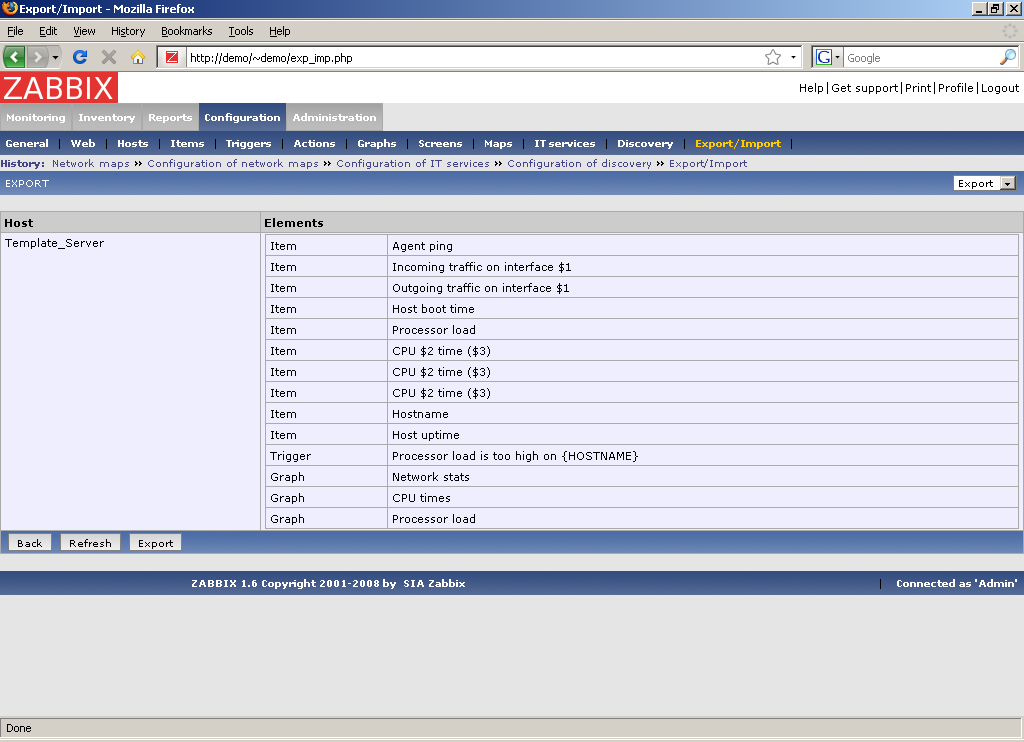
Preview page:
Import
The screen is used to perform XML import of host related data.
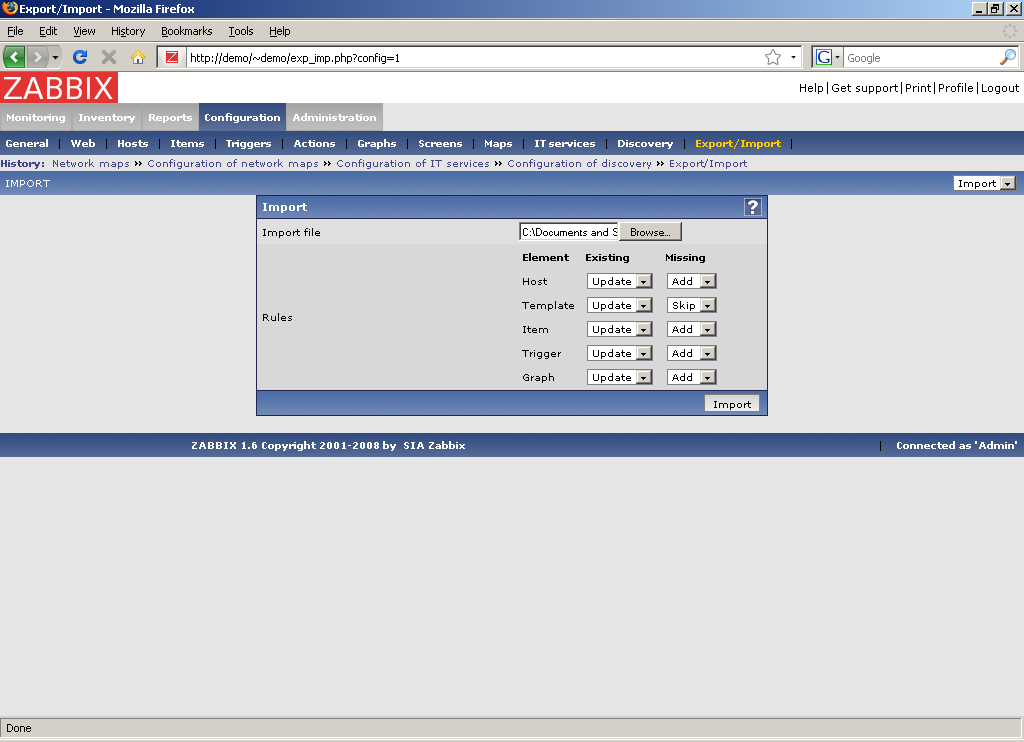
Import process options:
| Parameter | Description |
|---|---|
| Import file | XML file to import. |
| Rules | Set of rules for each type of element: Existing - what to do if element already exists Missing - what do to if element is missing Possible actions: Update - update existing element Add - add element Skip - do not process new data |
Press "Import" to import selected file.