
Table of Contents
- 7 What's new in Zabbix 1.8.3
- 7.1 Frontend changes
- 7.1.1 Global notifications
- 7.1.2 New frontend theme
- 7.1.3 Network map improvements
- 7.1.4 Unacknowledged trigger displaying in the dashboard
- 7.1.5 Reworked configuration section
- 7.1.6 More visibility for the trigger line
- 7.1.7 Improved log viewing filter
- 7.1.8 Search improvements
- 7.1.9 Unit blacklist created for items
- 7.1.10 Support for more units
- 7.1.11 Ability to choose 'All' as a period
- 7.1.12 Preview button in graph configuration
- 7.1.13 Supported macro changes
- 7.1.14 Improved proxy view
- 7.1.15 Item and trigger inheritance chain
- 7.1.16 Improved text item and logfile viewing
- 7.1.17 Improved y axis labels
- 7.1.18 Ability to unlink and clear templates upon mass update
- 7.1.19 Improved trigger status filter
- 7.1.20 Improved slideshow refresh rate selector
- 7.1.21 Translation updates
- 7.1.22 Other frontend improvements
- 7.2 Server and proxy changes
- 7.3 Other changes
- 7.1 Frontend changes
7 What's new in Zabbix 1.8.3
7.1 Frontend changes
7.1.1 Global notifications
Previously, working in some other location than Status of triggers or Dashboard pages would not show any information regarding issues that are currently happening. Starting with 1.8.3, support for global frontend notifications is added. Global notifications involve both showing a message and playing a sound.
Global notifications can be enabled per user in profile configuration. If enabled, global message timeout can be changed. By default, messages will stay on screen for 90 seconds.
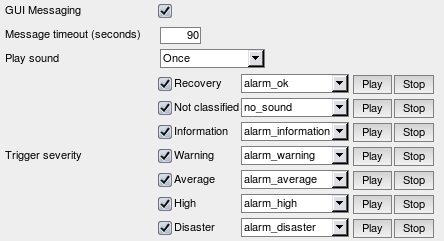
Additionally, it is possible to configure details of sound notifications. There are three possible options for playing a sound:
- Once - sound is played once and fully;
- 10 seconds - sound is repeated for 10 seconds;
- Message timeout - sound is repeated while the message is visible.
It is possible to receive messages for problems and for resolutions. Messages can be filtered based on trigger severity as well. For each trigger severity and recovery message sound to be played can be customised.
As the messages arrive, they are displayed in a floating section on the right hand side. This section can be repositioned vertically.
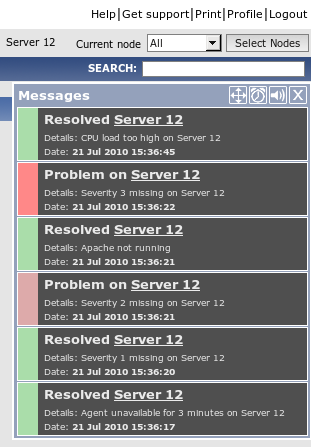
For this section, several controls are available:
 Move button allows to reposition the section vertically. This can also be done by dragging section header;
 Snooze button silences currently active alarm sound;
 Mute/Unmute button switches between playing and not playing the alarm sounds;
 Clear button removes all currently visible messages.
7.1.2 New frontend theme
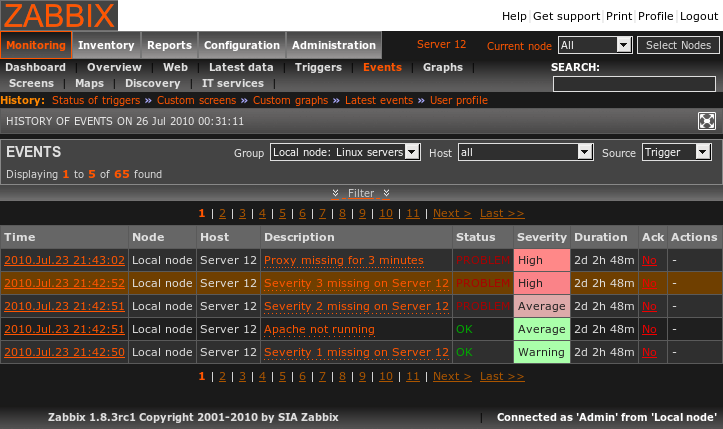
A new frontend theme has been added - Dark orange.
7.1.3 Network map improvements
7.1.3.1 Change marking in maps
A new per-map option has been introduced - ability to mark map elements that have their state changed recently.

When this option is enabled, any map elements that recently had state changed (trigger firing or resolving) are marked by red triangles.
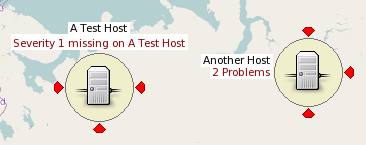
These triangles are placed on top, bottom, left and right of an object. If the object has a label, no triangle is displayed at the label location.
The period of showing these marks is the same as for trigger state flashing - 30 minutes.
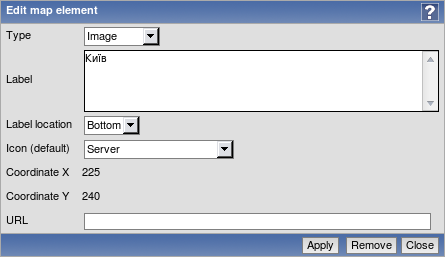
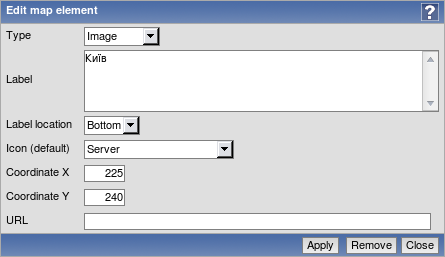
7.1.3.2 Icon aligning in maps
In previous 1.8 branch versions of Zabbix it was not easy enough to place icons in exact locations and align them nicely - with the gain of drag and drop ability to enter element position manually was lost. Now this ability is restored.
 |
 |
| 1.8.2 and before | 1.8.3 |
An even bigger improvement - map icon aligning was added.
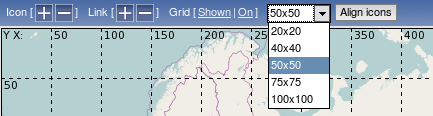
By default, grid for aligning is 50x50. Available grids:
- 20x20
- 40x40
- 50x50
- 75x75
- 100x100
If aligning is on, moving an icon will align it at the center of the grid cell. Clicking button Align icons will align all icons to the nearest grid cell. It is now also possible to hide grid while editing the map.
7.1.3.3 Improved link status indicator editing in maps
It is now easier to edit status indicators for map links - line style and colour can be changed directly from the list:
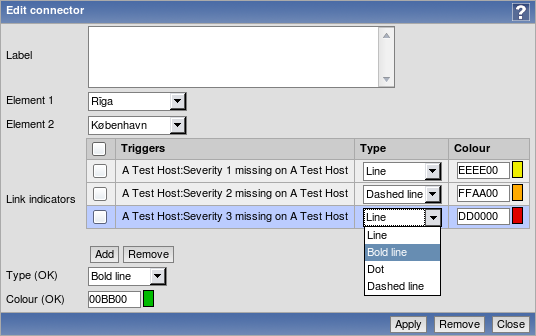
Additionally, it is now possible to add multiple indicators with same line style and colour in one go:
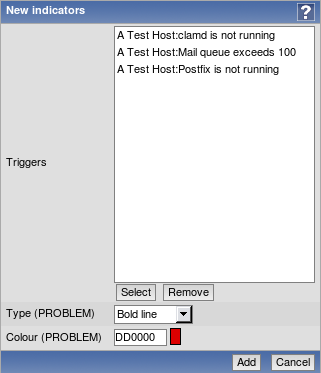
For the previous form, multiple triggers can be selected with checkboxes in the trigger list.
7.1.3.4 Image import and export
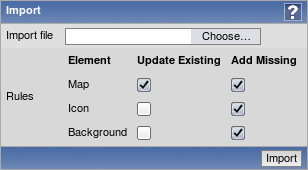
Available as a part of network map export and import, image export and import has been implemented. In the map import dialogue, there are checkboxes for icon or map background importing. This option is only available to Zabbix Super Administrators.
7.1.3.5 Map element highlighting changes
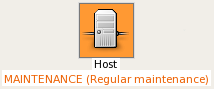
- Map element highlighting has been changed. Disabled elements in 1.8.3 have light grey background instead of dark red, and maintenance status background is slightly lighter.
| 1.8.2 and before | 1.8.3 | |
| Disabled |  |
 |
| In maintenance | 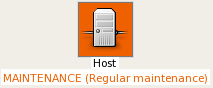 |
 |
- Now map element "map" has same icon highlighting as the map element "host group".
7.1.3.6 Other map improvements
- If multiple triggers with the same severity are assigned to the same map link, the one with the lowest ID takes precedence.
7.1.4 Unacknowledged trigger displaying in the dashboard
It is now possible to customise dashboard display depending on trigger acknowledgement state.
In the dashboard filter options, there is a new dropdown available, Problem display.
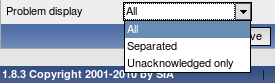
It provides 3 options:
- All - the default setting, which works just like before - displays all problems without any difference between acknowledged and unacknowledged ones.
- Separated - shows unacknowledged and all problems separately in the format <Unacknowledged> of <All>. Unacknowledged problems are displayed in bold, red font.
- Unacknowledged only - shows unacknowledged problems only. In this case they are also displayed in bold, red font to clarify that this option is being used.
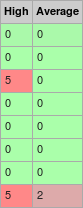
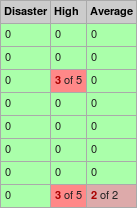
The difference between these 3 options can be seen here:
 |
 |
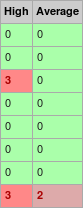 |
| All | Separated | Unacknowledged only |
When in the Separated mode, tooltip for each number shows the corresponding issues - either the unacknowledged ones, or all of them.
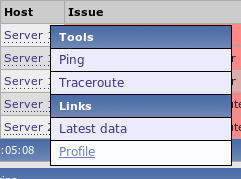
7.1.5 Reworked configuration section
Configuration section in 1.8.3 has been changed to improve usability.
- Template access has been brought out in the menu, as it was not that easy to find for new users. Additionally, last selected group is remembered separately for templates and for hosts now.
- Slideshow access has been brought out in the menu as a Slides entry.
- Because of template availability from the main menu it was possible to remove dropdown in Configuration → Hosts section. Host elements like items, triggers etc can be accessed from host configuration section, and template section provides same access for templates.
- Configuration → Export/import section was removed, instead moving import and export controls in corresponding host and template pages in the same way as for network maps and screens. Export can be accessed by marking templates or hosts and choosing an action at the bottom of the list, and for import a button has been added at the top of the page.
 |
 |
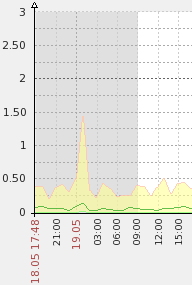
7.1.6 More visibility for the trigger line
Trigger line in Zabbix graphs was extremely hard to spot in latest Zabbix versions. In 1.8.3, the line has been changed from 1 pixel height to 2 pixels. It also adds two additional changes:
- a 3 pixel long dashed black line is drawn on top of the trigger line;
- trigger line itself is coloured, according to the trigger severity (so it's light yellow for Warning severity and heavy red for Disaster).
These changes should change the trigger line from nearly invisible to very clearly visible - let's compare the 1.8.2 version and 1.8.3 one. In 1.8.2 trigger line is invisible unless the observer knows it's there.
 |
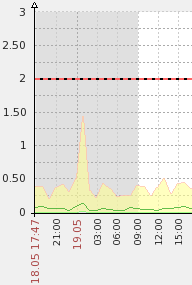 |
| Trigger line in 1.8.2 | Trigger line in 1.8.3 |
7.1.7 Improved log viewing filter
Log viewing filter was brought in line with other filters in regard to being hideable. It was also redesigned, especially to make handling of multiple logfiles easier.
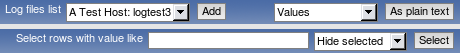 |
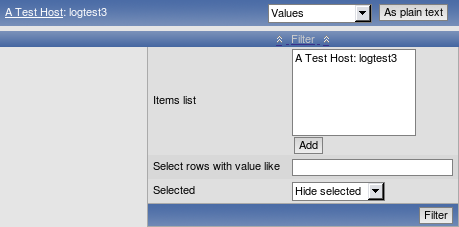 |
| Log filter in 1.8.2 and before | Log filter in 1.8.3 |
Additionally, this filter is also available now for text items, not for log items only.
7.1.8 Search improvements
Zabbix 1.8.3 has received two improvements to the global search functionality.
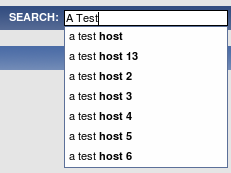
7.1.8.1 Search suggestions
Global search now provides suggestions, based on the entered string. This string is matched against hosts only and all suggestions are lowercase independent on the actual case of the hostname.
7.1.8.2 Improved search results
Search results form has been greatly improved.
- Instead of showing many "Go" links, all links now list the actual target. That makes using them much easier.
- Instead of using a dropdown and "Go" button, editing options for hosts now are shown in a table form, requiring less clicks to achieve the desired result.
- Count for all elements in host and template result boxes is shown.
- Links to application configuration have been added.
- Host and template names can be clicked now to access host or template properties directly.
- Disabled hosts are shown in red to provide more information.
While the new search results form is wider, it should be much more functional now:
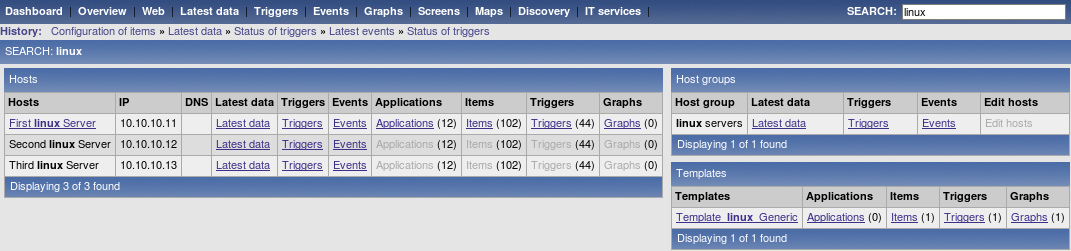
In this screenshot, user has write access only to host First Linux Server, so editing options for other hosts are not available.
7.1.9 Unit blacklist created for items
By default, specifying a unit for an item results in the multiplier prefix being added - for example, value '2048' with unit B would be displayed as 2KB. For a pre-defined, hard-coded list of units this is now prevented:
- %
- ms
- rpm
7.1.10 Support for more units
Support for the following units has been added for graph y axis:
- milli (m);
- micro (µ);
- nano (n).
Note that smallest available units might limited by available database field precision.
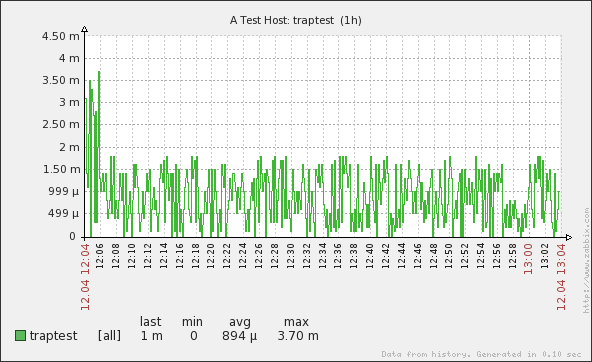
7.1.11 Ability to choose 'All' as a period
It is now possible to choose All as a period in graphs and elsewhere.

Maximal period currently is limited to two years.
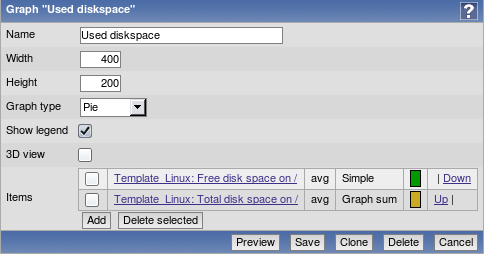
7.1.12 Preview button in graph configuration
Previously, changing any parameter in the graph configuration would regenerate the graph. Now it only happens when really necessary, and button Preview has been added to force regenerating.
7.1.13 Supported macro changes
Macro {TRIGGER.EVENTS.UNACK} now is supported in map element labels. Additionally, these macros now expand to the following values:
| Macro | Value |
|---|---|
| {TRIGGER.EVENTS.UNACK} | Number of unacknowledged events for a map element in maps, or for the trigger which generated current event in notifications. |
| {TRIGGER.EVENTS.PROBLEM.UNACK} | Number of unacknowledged PROBLEM events for all triggers disregarding their state. |
| {TRIGGERS.UNACK} | Number of unacknowledged triggers for a map element, disregarding trigger state. |
| {TRIGGERS.PROBLEM.UNACK} | Number of unacknowledged PROBLEM triggers for a map element. |
| {TRIGGER.PROBLEM.EVENTS.PROBLEM.UNACK} | Number of unacknowledged PROBLEM events for triggers in PROBLEM state. |
The following new macros have been added:
| Macro | Value |
|---|---|
| {TRIGGER.EVENTS.ACK} | Number of acknowledged events for a map element in maps, or for the trigger which generated current event in notifications. |
| {TRIGGER.EVENTS.PROBLEM.ACK} | Number of acknowledged PROBLEM events for all triggers disregarding their state. |
| {TRIGGER.PROBLEM.EVENTS.PROBLEM.ACK} | Number of acknowledged PROBLEM events for triggers in PROBLEM state. |
| {TRIGGERS.ACK} | Number of acknowledged triggers for a map element, disregarding trigger state. |
| {TRIGGERS.PROBLEM.ACK} | Number of acknowledged PROBLEM triggers for a map element. |
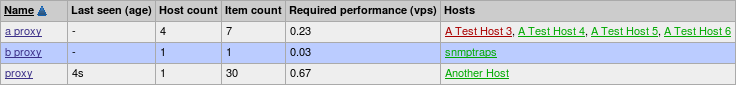
7.1.14 Improved proxy view
Proxy view in Administration → DM → Proxies has been improved by adding two new columns - item count and required performance (showing same information as in the server status report, new values per second). That should help with proxy hardware requirement estimates.
7.1.15 Item and trigger inheritance chain
If an item or a trigger is coming from a nested template chain, it isn't always obvious how exactly is it attached to the host. Since 1.8.3, in item or trigger editing form header full inheritance chain is shown, and it is possible to click on any template to see item editing form for that template.
|<| |<| |-|
|<| |<| |-|
7.1.16 Improved text item and logfile viewing
In 1.8.2 and before, text item history had lots of vertical whitespace. Because of this less lines could fit in a screen. In 1.8.3, vertical whitespace has been reduced considerably.
 |
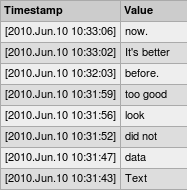 |
| Text data in 1.8.2 and before | Text data in 1.8.3 |
Note that in Zabbix history viewing newer items are at the top, so you have to read lines from bottom up.
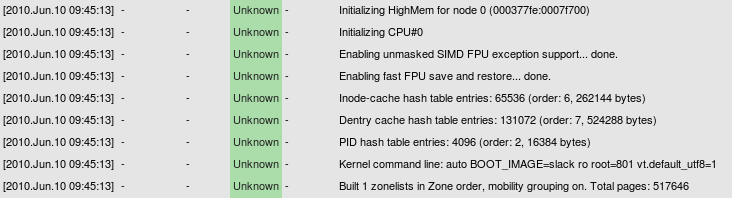
While logfile viewing did not have so much excessive vertical whitespace, it could still be slightly reduced even when adding table lines in 1.8.3.
 |
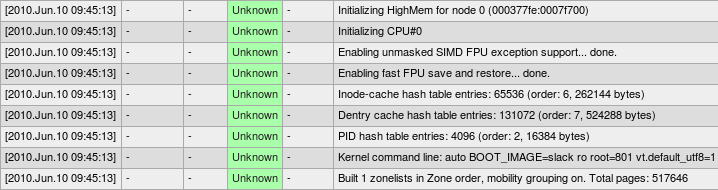 |
| Log data in 1.8.2 and before | Log data in 1.8.3 |
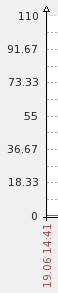
7.1.17 Improved y axis labels
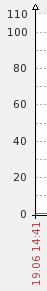
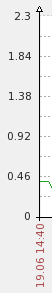
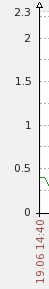
In previous versions, y axis labels for Zabbix graphs were displayed at even distances for full graph scale. In some cases, this resulted in label values that were hard to read. For example, graph going from 0 to 100 would have labels including 18.33, 36.67 and 91.67. In Zabbix 1.8.3, label calculation is improved. Zabbix will split the scale based on some round value, thus in our example values would become 20, 40 and 80. Additionally, if the graph has manual maximum scale entered, it is always printed. If printing the maximum would collide with last rounded value, last rounded value is hidden. For example, on scale from 0 to 110 both of the labels 100 and 110 are printed. On scale from 0 to 101 only the label 101 is printed.
These benefits are visible both with large and small graph values.
| Large values | Small values | |||
|---|---|---|---|---|
 |
 |
 |
 |
|
| 1.8.2 and before | 1.8.3 | 1.8.2 and before | 1.8.3 | |
7.1.18 Ability to unlink and clear templates upon mass update
It is now possible to "unlink and clear" (which not only unlinks the templates, but also deletes the linked elements) templates for host mass update. For this purpose, checkbox "Clear when unlinking" must be marked in the "Replace linked templates" section of the host mass update screen:
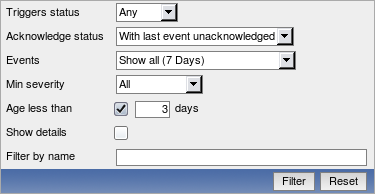
7.1.19 Improved trigger status filter
The filter in the "Status of Triggers" page has been improved. Trigger acknowledge status has been brought out in a separate menu, and a new filtering option is available - "With last event unacknowledged". With these changes it is again possible to display all (including those in OK state) triggers for all hosts and host groups.
It is also now possible to filter triggers by age - option "Age less than" allows to only show those triggers that have changed state in last N days.
Additionally, several options have been renamed to make it more clear what they are about - for example, Select became Filter by name.
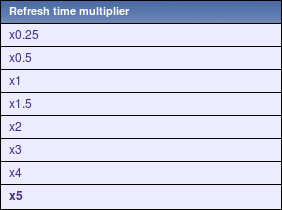
7.1.20 Improved slideshow refresh rate selector
Instead of providing fixed periods, slideshow refresh can now be set to multiples of default settings. This allows to slow down or speed up slideshow displaying while still maintaining relative time of displaying for each slide.
7.1.21 Translation updates
The following new translations have been added:
- Czech.
The following translations have been updated:
- Brazilian Portuguese;
- Chinese;
- French;
- German;
- Hungarian;
- Japanese;
- Latvian;
- Russian;
- Ukrainian.
7.1.22 Other frontend improvements
- Monitoring → Triggers section now shows the time it was last refreshed in the header.
- It is now possible to select multiple graphs, screens and maps when adding them to favourites on the dashboard.
- It is now possible to configure default axis side. Set in include/defines.inc.php, parameter GRAPH_YAXIS_SIDE_DEFAULT controls this. See frontend definition documentation for more information.
- Date formats can now be specified as a part of the locale, thus appropriate format for each region can be used now.
- In calculated item editing, field Expression was renamed to Formula to be less confusing (because triggers already had expression).
- Trigger option Multiple TRUE events was renamed to Multiple PROBLEM events to be consistent with other locations.
- Maximum rows per page and search limit increased to 99999.
- Screen name is shown when editing a screen.
- Row highlighting colour has been changed to be more visible.
| Highlighting in 1.8.2 and before | 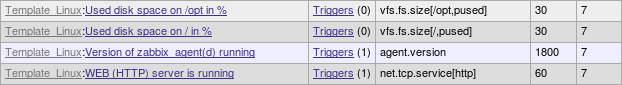 |
| Highlighting in 1.8.3 | 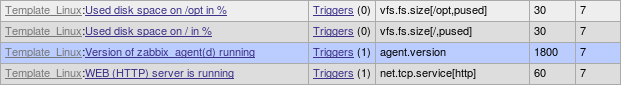 |
- Being in maintenance is also displayed in the Status column in the host configuration page.

- If a URL is included in host profile information and it starts with http or https, it results in a clickable link in the inventory section.
- Host status now indicated by the text colour used for the host name in most locations in the frontend.
- Improved user macro handling - they can also be edited now.
- Switching item configuration filter options won't reload the item list immediately anymore, thus making filter easier to use on large installations. Also changing most options in item editing form won't reload it, just the appropriate fields will be updated - that should make item configuration easier.
- Improved performance by eliminating needless DISTINCT keyword usage. Some queries have improved in speed from 30 seconds to 0.1 second.
- Alternating row colours removed from all editing forms (they are still present in lists) and form background colour unified across the frontend.
- Long host, host group and graph names could push selection dropdowns past the right edge of the browser window. In 1.8.3, the situation is improved by limiting dropdown width if element names are too long. Full names are still used in the dropdown itself.
- Improved audit section names in dropdown and page header.
- Bundled DejaVu font upgraded from 2.30 to 2.31.
- Added link to host profile from dashboard, if host has profile information populated.
7.2 Server and proxy changes
7.2.1 Passive Zabbix proxy
Up to Zabbix version 1.8.3 Zabbix proxy was the one connecting to Zabbix server, and that was the only supported mode. But if one would like to place Zabbix server inside the local network which would monitor host in DMZ by proxy, that would not be possible - connection would have to go the other way.
Starting with version 1.8.3, Zabbix server and proxy communication can be in either direction. To control this, several new options have been introduced.
- ProxyMode - controls the mode that proxy works in. By default, proxy works in active mode (connecting to sever). Setting this parameter to 1 will make proxy wait for incoming server connections.
- StartProxyPollers - how many special pollers for passive proxies to start.
- ProxyConfigFrequency - how often Zabbix server sends configuration changes to passive proxies.
- ProxyDataFrequency - how often Zabbix server requests data from passive proxies.
7.2.2 Changed configuration parameters
- Performance improvements in database synchronisation by introducing new server configuration parameter - StartDBSyncers. This allows to parallelise data writing to the database, resulting in notable improvement on powerful hardware. By default 4 DB syncers are started.
- Made poller balancing more intuitive by making them take items from a single item queue. As a consequence, unreachable server polling has also been improved and StartPollersUnreachable configuration parameter has been removed.
7.2.3 Server performance improvements
- Improved performance by not storing some runtime data in the database.
- Improved performance of updating trends in memory and their flushing to disk by caching required information.
- Faster configuration cache building both by improved SQL queries and in-memory optimisations.
7.2.4 Other server improvements
- Processes now provide more information on why they terminate. This should help greatly with Zabbix daemon debugging.
- Reduced amount of memory required for Zabbix server by storing repeated strings (like item keys) only once in the memory. On larger setups this can result in tenfold reduction in the memory usage.
- Zabbix daemons now support binding to multiple network interfaces, thus it is possible to specify comma-separated list to the ListenIP directive.
- Multirow inserts are used for PostgreSQL 8.2 and higher, which should improve the performance.
- If an e-mail subject would contain ASCII characters only, it won't be Base64 encoded anymore (originally implemented in 1.8.2).
- Hostname is now printed in server error messages about simple checks. That should ease debugging of failing items.
- Outdated environment variable setting for alert scripts has been removed.
7.3 Other changes
7.3.1 New supported and changed items
7.3.1.1 Table record count
In addition to previously supported zabbix[history] and zabbix[trends] items, Zabbix now supports additional items to monitor amount of values in corresponding tables. Note that on most database engines usage of these items can seriously degrade the performance.
- zabbix[history_log]
- zabbix[history_str]
- zabbix[history_text]
- zabbix[history_uint]
- zabbix[trends_uint]
7.3.1.2 New simple checks
The following simple checks have been added:
- ldap
- ldap_perf
- ntp
- ntp_perf
7.3.1.3 More advanced queue item
Zabbix internal item zabbix[queue] gained parameter support. It is now possible to specify for how long item must be missing data to be counted. For example, zabbix[queue,6,59] will count all items that are late by 6-59 seconds, inclusive. Time based suffixes are supported for these parameters, so the following syntax will check for all items that are haven't been refreshed between one minute and 6 hours: zabbix[queue,1m,6h].
By default first value is 6, and second value is empty, which means infinity.
7.3.1.4 Item changes
- Parameter service.ntp for item keys net.tcp.service and net.tcp.service.perf renamed to ntp. Old syntax is still supported.
7.3.2 Changed acknowledge logic
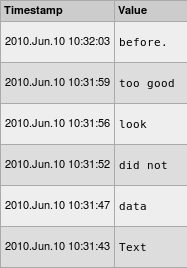
This version changes how acknowledge works. In previous versions, if a trigger was acknowledged and changed state to UNKNOWN, then back, this new event would not be acknowledged (and in turn, trigger would become un-acknowledged). Since version 1.8.3, any acknowledge is copied to all events of the same type that are separated by UNKNOWN events. For example, if events have happened like this (newer events on top):
Acknowledging event number 3 in the frontend would add the same acknowledge to event 5, and vice versa. If new events would now happen:
In this case Zabbix server would add the acknowledge (if any) from event 9 to the new PROBLEM event number 11.
There is one exception - multiple TRUE (PROBLEM) triggers do not get the acknowledges copied over from other events.
7.3.3 Requirement changes
7.3.3.1 MySQL 5.5 supported
Upcoming MySQL version 5.5 drops support for table keyword type, and using ENGINE is required. Zabbix 1.8.3 changes to usage of keyword ENGINE.