
- 4. What's new in Zabbix 1.8
- Notable improvements
- New features and improvements for the frontend
- Bar reports
- Full Unicode support
- Improved time period navigation
- Improved graphs
- Improved map editing
- Changed configuration layout
- Visual trigger editing frontend
- New and improved filters
- Improved screen editing
- Global search
- Minor frontend improvements
- API
- Improvements for larger installations
- Various
- Host maintenance
- Improved audit log
- New macros
- Advanced regular expression editor
- IPv6 support for SNMP monitoring
- Supported PHP version changes
- Minor improvements
- Basic authentication support in web monitoring
- New and improved monitored metrics
- New input data types
- Client utilities moved to bin
- Improved sample configuration files
- Added manpages
- Notification media can be chosen in action operations
- Timestamp support for zabbix_sender
- Manual user unblocking
- Native support of Oracle
- Host status propagation from proxies
- Rotated logfile monitoring
- Online documentation
- Detailed availability information displaying
- What's new in further releases
- Installation and upgrade
4. What's new in Zabbix 1.8
More than a year in making, Zabbix 1.8 has arrived with lots of new features, as well as improved old ones. You can introduce yourself to the changes for this new version of Zabbix in the following section.
Notable improvements
With so many changes it is impossible to pick 3 most notable ones - which is attempted below. For this reason, it is suggested to read on, as some generally minor feature might be very important to you.
New features and improvements for the frontend
Zabbix web frontend is the feature that sets it apart from other solutions. Powerful, yet easy to use official GUI is shipped with the default package. It provides both non-intimidating access for novice users and large scale configuration features for sizable installations.
Being most user-visible part, we will start by looking at many new features and improvements in Zabbix 1.8 for the web frontend.
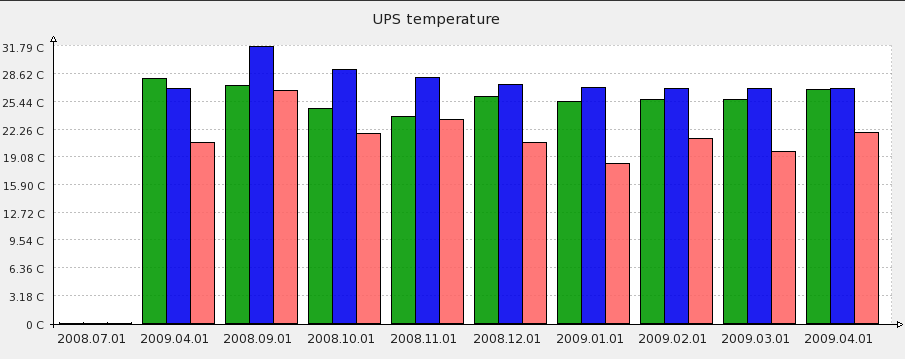
Bar reports
Zabbix already has easy to use simple graphs that do not require any configuration - these are provided for every numeric item. Custom graphs, along with a couple simplistic reports, allow to look at the data in context. Zabbix 1.8 brings much more powerful built-in reporting.
New report category, bar reports, allows to look at the data from many different angles. Want to look at the weekly temperatures in the server room for the last two months? Have to compare webserver load for the first month of every quarter this year? All that and more is possible with this new feature.
Full Unicode support
While previous Zabbix versions were multi-language friendly, providing several frontend translations, it was not a truly global thing - the most popular encoding, Unicode, was not fully supported.
Zabbix 1.8 now fully supports Unicode/UTF-8, allowing for a true localised or multilanguage setup.
Improved time period navigation
In Zabbix, single control is used to select time period displayed for many views, including simple and custom graphs, raw data, screens and web monitoring. Already improved in 1.6, time period selector has been improved in 1.8 further.

This scrollbar allows easy dragging and resizing of it. Additionally, links on the left hand side allow to choose some predefined, often used time periods and move displayed period forward/backward in time. And the dates on the right hand side actually work as links, popping up a calendar and allowing to set specific start/end time.
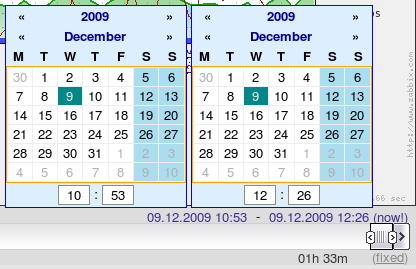
Notice the dynamic/fixed link in the lower right hand corner? It can be used to control whether time period is kept constant when you change start/end time.
In addition to the screenshots you can also view the video of using graph time period controls.
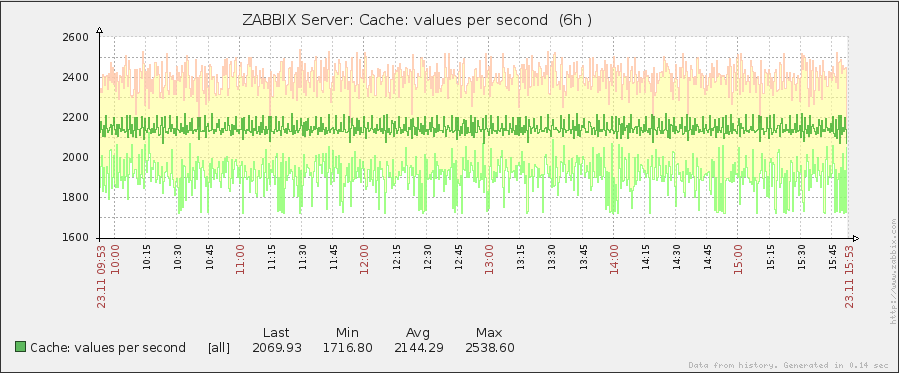
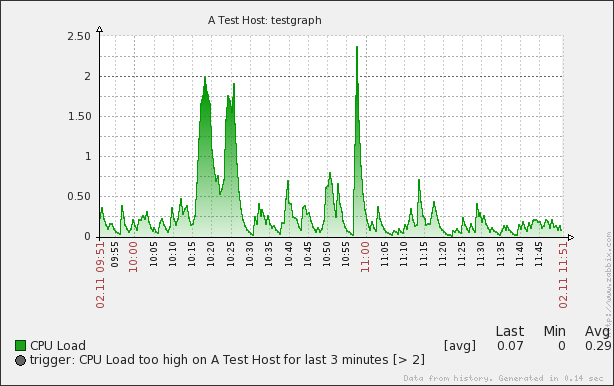
Improved graphs
Zabbix graphs have been improved in many ways. This includes both visual and functional improvements, like the time period selector already mentioned. For example, information about max/min/avg values is presented clearly as a table.
Improved timeline in charts
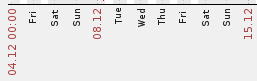
Zabbix graphs - or charts - usually display time on x axis. And even this representation has been improved in the new version.
Comparing 1.6 and 1.8:
As can be seen, labels are now easier to read. Instead of prioritising some arbitrary point in time, depending on graph scale, actual points in time like change of a day are prioritised. Sometimes Zabbix will even use more "human readable" labels:
Gradient line support in graphs
Zabbix graphs support several line styles, and 1.8 brings one more - gradient line. It's easier to understand how that works by looking at an actual example.
DejaVu font used for graphs
DejaVu font is now used for graphs for nice looking text - and for Unicode capabilities.
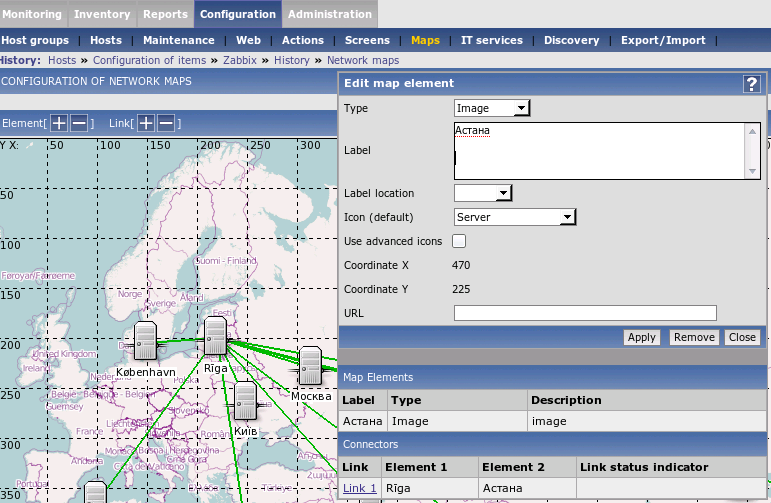
Improved map editing
Zabbix supports network maps where monitored environment can be laid out on a background image to provide user friendly overview.
In previous versions, editing such network maps was not easy - coordinates of each element on the map had to be specified manually.
Map editing in Zabbix 1.8 has been greatly improved by adding drag and drop support, as well as selected element detail displaying in a popup.
You can even watch a video of map editing.
In addition to that map links may have optional text for displaying arbitrary information, for example, bandwidth data.
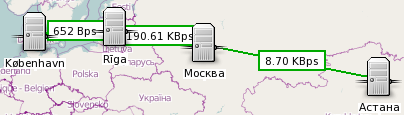
Background map CC-BY-SA Openstreetmap.
Changed configuration layout
Zabbix web frontend provides convenient way to display and visualise received data, as well as configure all aspects of monitoring.
Layout of this configuration has been redone in 1.8. Instead of separate sections for items, graphs, triggers and so on, they are folded into host configuration section, where convenient linking allows for easy access to all of these entities and more.
On the other hand, host group configuration has been brought out on the configuration menu.
Another change is general configuration being moved to administration section to avoid Zabbix administrator level users from having access to global configuration parameters.
Visual trigger editing frontend
Usage thresholds and any other problem conditions are freely configurable by user. These definitions are called triggers, and complex expressions can be used for each trigger to define what is considered a problem.
In addition to ability to edit trigger expressions directly, a frontend to create triggers visually has been added.
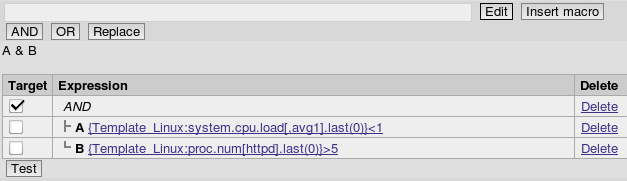
There is a special mode for creating log related triggers.
It also incorporates ability to provide test data and try out trigger behaviour.
(screenshot)
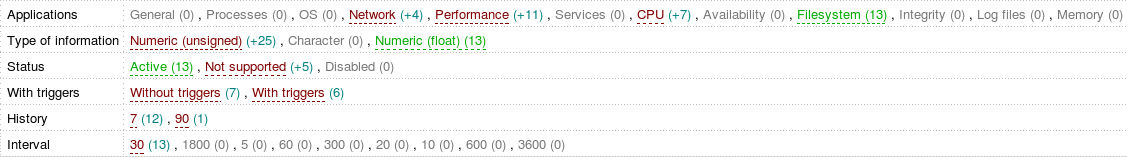
New and improved filters
As Zabbix frontend provides means to access all the information, it can be a daunting task to find the desired one. Previous versions offered ways to filter this information, and 1.8 improves situation in this regard by adding new filters and making existing ones more powerful.
Items filter
Item configuration section is the one where all aspects regarding data gathering are configured, thus it is displaying quite a lot of information. Being able to quickly find desired data gathering entries is crucial to efficient configuration, and in Zabbix 1.8 there's an improved filter for items that allows for much more detailed searching.
(screenshot)
After performing initial filtering, subfilter becomes available. It presents found values and results can be filtered further.
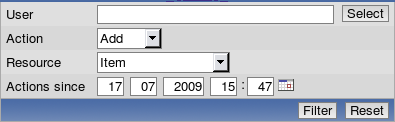
Audit filter
Accountability is important on any system with more than one user (and on many systems with single user as well). Zabbix frontend records all operations in an audit log.
In version 1.8 audit logs now can be filtered quite extensively to find exactly the changes you are looking for.
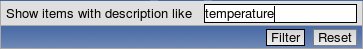
Latest data filter
Looking at shiny graphs is tempting, but sometimes you need the real data. Latest data section in Zabbix frontend allows to see exact values for all monitored metrics.
It is now possible to filter this screen by freeform search against item descriptions.
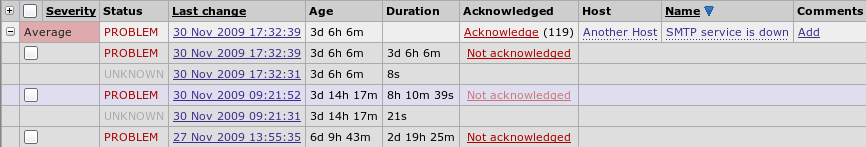
Reworked "Status of triggers" view
Trigger view is widely used to display list of current problems, and it was possible to display recent events for all the problems, limited by day count.
In 1.8, this screen gained has been changed, providing new features like expanding individual triggers to show their events and confirming all events for a trigger.
Other filters improved
Filters in other sections of the frontend have been improved as well, allowing to get to the data easier and more quickly.
Improved screen editing
Zabbix screens is a feature that allows to group many frontend elements, including graphs, network maps, raw data and many others. Configuring them initially was not very hard, but making any significant changes was nearly impossible in some cases.
Screen editing has been greatly improved in 1.8. This includes:
- Drag and drop support. Dragging an element to empty cell will move it there, dragging an element on occupied cell will switch these elements. You can watch a video of this feature (site also allows to download original .ogg video).
- Using icons on the screen edges, rows now can be inserted and removed from arbitrary locations.
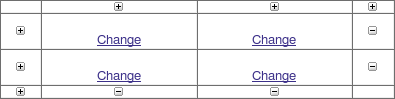
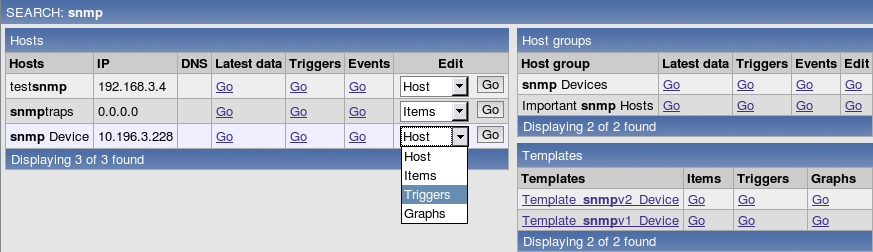
Global search
There's now a search box in the upper right corner, which allows searching in hosts, host groups and templates.

Results allow for a quick access to found entities and their elements:
Minor frontend improvements
For a GUI minor visual change can bring large benefits to the user. Zabbix 1.8 has many minor improvements and features that should make working more productive and pleasant.
Cleaner error displaying
Error messages are now shown as icons and error text is available in a popup. Clicking the icon opens the popup to allow copying of the message.

History strings saved by reference
At the top of the frontend, there's a breadcrumbs type history, showing recently accessed pages.

When a language is switched in frontend, in previous versions existing history entries would not switch language, only new entries would be added in the correct language. Now history strings change appropriately.
Paging for entity lists added
Many locations of Zabbix frontend present information as lists - whether it's a list of hosts, items or triggers. These lists can get quite long on large installations of Zabbix, and that slows down frontend considerably.
Zabbix 1.8 supports splitting long lists in multiple pages. Entry count per page is configurable in user's profile.
Selected rows are highlighted now
Most of the entries in these lists can be selected for performing some operation on them.
A minor but welcome improvement in 1.8 - selected rows now are hilighted.
Ability to display server name
Setting variable ZBX_SERVER_NAME allows Zabbix server name to be displayed in the frontend upper right corner.
It is also used in page title.
More flexible linked items
Zabbix supports very powerful templating that makes large scale configuration management easy. Templates can be linked to monitored hosts and they determine what and how is monitored.
Downstream linked items in Zabbix 1.8 are more flexible now - for example, it is possible to edit SNMP parameters like community string, or allowed hosts for trapper items, in items that are linked in from templates.
IP address becomes default option
In host creation form, IP address is now the default choice.
Debug mode added for frontend
Mostly useful for developers, but can be handy when trying to determine source of a problem for others as well.
Debug mode can be enabled on user group basis.
Help icons lead to online manual
Oldtime Zabbix users might remember the days when help icons from Zabbix frontend linked to the online manual. With the conversion to online documentation that again is possible, and in Zabbix 1.8 most of these icons open Zabbix manual in a new browser window or tab.
API
In version 1.8 first, Zabbix provides JSON-RPC API. It already allows to perform most of the configuration changes, thus enabling powerful means for automated or complex setup management.
While API itself might not be that exciting for casual users, it enables creation of various tools. One such tool already has been created - Zabbix commandline utility or Zabcon.
Zabcon is especially exciting for users who would like to perform uncommon, large scale changes, as it allows easy scripting without programming skills.
Zabbix management from servers without GUI installed also is expected to be possible, and surely users will come up with innovative and impressing uses for this tool.
Note: API is currently considered to be in a technical preview state and can change in next versions.
Improvements for larger installations
Zabbix is being used in larger and larger environments every day. 1.8 release introduces several changes that are specifically useful in average and above setups.
Performance improvements
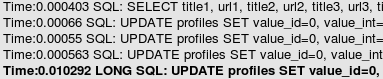
When monitoring hundreds and thousands of devices, load on the monitoring server hardware can become a serious issue. Zabbix 1.8 brings many different improvements to the performance in several key areas.
Increased Zabbix server and proxy performance
Doing the main work behind the scenes, Zabbix server has been improved greatly to allow gathering more data on the same hardware. As Zabbix proxy shares some code with the server, it has benefited from these changes as well.
Much more efficient polling
Hundreds of pollers can be executed for greater parallelism and performance. The pollers do not communicate directly with the database and use very little of server CPU and memory resources.
Added configuration data cache module
Database cache is enabled by default and can not be disabled. Configuration option StartDBSyncers has been removed from Zabbix server and proxy configuration files.
A special internal check has been introduced, zabbix[wcache,*] to monitor health of this cache.
Frontend images recompressed with pngcrush
To reduce amount of data that users have to retrieve from webserver when using Zabbix frontend, all PNG images have been recompressed for optimal size.
Items with SNMP dynamic index use one connection
Zabbix supports monitoring SNMP metrics that have dynamic identifiers.
In version 1.8 index resolving and data retrieval is performed in a single connection now, reducing network load and load on the monitored devices.
Automated host management improvements
For larger or constantly changing environments replicating these changes in Zabbix configuration can be a challenge. Zabbix already supported network discovery, and 1.8 now brings both improvements to the network discovery, as well as new methods to automate adding of new devices to monitor.
Network discovery improvements
Network discovery, available in previous versions, has received multiple improvements.
Port interval support
For services where it's appropriate, port interval support has been added.
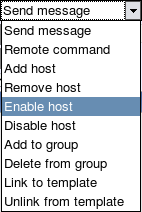
New action operations
Based on discovery events, two new operations have been added, thus increasing available operation count for network discovery to 10.
- Enable host
- Disable host
IP mask support
Industry standard network mask notation can now be used in network discovery, for example, 192.168.1.0/24.
Support for multihomed devices
If a host provides some service on multiple IP addresses, it would be discovered as multiple hosts in Zabbix versions before 1.8. Starting with 1.8, it is possible to use different uniqueness criteria for some services, for example system.uname returned by Zabbix agent or any OID returned by SNMP capable host.
SNMPv3 support
Network discovery in Zabbix 1.8 supports SNMPv3 with all the corresponding functionality.
Auto registration for active agents
Completely new in Zabbix 1.8, it is possible to allow active Zabbix agent auto-registration, after which server can start monitoring them. This allows to add new hosts for monitoring without any manual server configuration for each individual host.
The feature might be very handy for automatic monitoring of new Cloud nodes. As soon as you have a new node in the Cloud Zabbix will automatically start collection of performance and availability data of the host.
Support for global, template and host level macros
Support for user definable macros (or variables) has been added. These can be defined globally for Zabbix installation, on template and host level. For example, defining the following macros on a host level allows to set custom thresholds per host, even if all hosts are linked against single template:
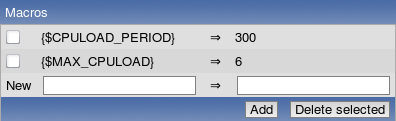
In this case, templated trigger expression would be:
{ca_001:system.cpu.load[,avg1].min({$CPULOAD_PERIOD})}>{$MAX_CPULOAD}Various
Host maintenance
Host and host group maintenance has been added to Zabbix.
Hosts that are in maintenance are indicated as such in Monitoring → Triggers view.

If a problem happens during the maintenance and is not resolved, notification is generated after maintenance period ends.
If a log item is added while host is in maintenance and maintenance ends, only new logfile entries since the end of the maintenance will be gathered.
Improved audit log
Zabbix provides accontability by recording all user logins and changes to the Zabbix configuration in the audit log.
Audit log in 1.8 has been improved, and instead of simply seeing that something has changed, many entities will have exact changes recorded.
New macros
Zabbix provides very useful variables - called macros - to be used in item names, notifications and elsewhere. Zabbix 1.8 increases the amount of available macros, as well as making some macros usable in more locations.
In notifications
Along with existing macros new ones can be used in notifications that are sent out.
- {NODE.*[1..9]}
- {ITEM.LOG.*[1..9]}
- {ITEM.VALUE} and {ITEM.VALUE[1..9]}
- {ITEM.LASTVALUE[1..9]}
- {HOST.CONN[1..9]} {HOST.DNS[1..9]} {IPADDRESS[1..9]}
- {TRIGGER.KEY[1..9]}
- {HOSTNAME[1..9]}
- {ITEM.NAME[1..9]}
- {PROFILE.*[1..9]}
- {EVENT.ACK.STATUS}
- {EVENT.ACK.HISTORY}
- {TRIGGER.EVENTS.UNACK}
In map labels
Map labels allow using handy macros like the current value of some item.
- {TRIGGERS.UNACK}
Advanced regular expression editor
Advanced regular expression editor was added to Zabbix with ability to test regular expressions. It is now possible to define complex regular expression with easy to use interface and reuse them with simple reference.
IPv6 support for SNMP monitoring
In addition to the SNMP related improvements for network discovery, IPv6 support has been implemented for SNMP monitoring.
Supported PHP version changes
Zabbix frontend is based on PHP. Since the last stable Zabbix release there have been major changes in PHP versions, and Zabbix frontend has been changed accordingly.
Support for PHP 5.3 added
Released in 2009.06.30, PHP 5.3.0 was out for some time to require support of Zabbix frontend.
Support for PHP 4 dropped
Last bugfix release in 2008.01.03 and last release with security fixes in 2008.08.07, PHP4 was not receiving bugfixes anymore.
Zabbix 1.8 requires PHP 5.0 or later.
Minor improvements
We call these minor, but for somebody one of these might be the biggest change in Zabbix 1.8.
Basic authentication support in web monitoring
Web monitoring now supports basic HTTP authentication. It can be configured per scenario.
New and improved monitored metrics
While Zabbix can be extended, built-in checks require less resources and are easier to use. Zabbix 1.8 introduces several new checks and improves old ones.
New items
Several completely new items have appeared.
- icmppingloss
- net.tcp.dns.query
CPU switches support on Linux
Key system.cpu.switches can be used for Linux hosts.
Added Windows services key
Added services key for Windows which can return services in a particular state.
ICMP items have new parameters
Zabbix ICMP items now are much more flexible. Item icmpping has gained the following parameters:
- target - host IP or DNS name;
- count - number of packets;
- interval - time between successive packets in milliseconds;
- size - packet size in bytes;
- timeout - timeout in milliseconds.
Now it is possible to use a key like this:
icmpping[10.10.10.10,5,300,128,100]This would send five 128 byte packets to host with IP 10.10.10.10 with 300 ms interval between them, and use 100 ms timeout.
Item icmppingsec has gained all the above parameters, and one additional:
- mode - one of min, max, avg.
Default mode is avg.
'maxlines' parameter for log items
Item keys log and eventlog now have new parameter - maxlines. It specifies maximum number of new lines per second the agent will send to Zabbix server or Proxy.
By default, Zabbix agent does not send more than 100 log lines per second per log file. For fast growing file the number can be increased using the new parameter.
New Windows eventlog filters
Windows eventlog entries now can be filtered by type, source and event ID on the agent side.
SSH and telnet checks
Now SSH and telnet can be used for direct, agent-less monitoring. SSH supports both password and key authentication methods.
It makes possible very effective remote monitoring of network devices, appliances and servers without use of Zabbix Agent.
Currently SSH and telnet cannot be used in actions, this functionality will be available in future releases.
LVM swap devices support
LVM devices are now supported as swap devices on Linux.
First CPU number changed on Linux
First CPU on Linux is now referred to as 0, which is consistent with other operating systems.
Positive sign for decimal values supported
If incoming decimal (float) value is preceded by a + sign, it is supported as a positive number now.
New input data types
While different base values could be monitored before with user parameters, that was not easy enough. Zabbix 1.8 natively supports two new input data types, sometimes found on devices like printers.
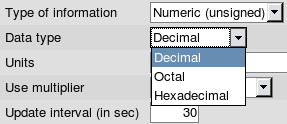
- Octal
- Hexadecimal
Client utilities moved to bin
Zabbix client utilities zabbix_get and zabbix_sender were moved from sbin to bin.
Improved sample configuration files
Sample configuration file layout was changed. Now all parameters are included, and their default values, as well as allowed ranges, are documented.
Added manpages
Manpages for all Zabbix processes have been added.
Notification media can be chosen in action operations
It means that it's possible to define messages that will be sent to one or several media only. For example, all critical messages can be delivered by using SMS messaging, while other messages using both email and SMS without creating multiple actions.
Timestamp support for zabbix_sender
Support for -T parameter in zabbix_sender has been added, which allows to set timestamp for each value. The option can be used to migrate older historical data from other monitoring tools to Zabbix database for graphing and long-term analysis.
Manual user unblocking
Ability to manually unblock users who have been locked out by bruteforce protection was added.

Clicking on the Blocked link will unblock this user.
Native support of Oracle
Previous version of Zabbix had a dependency on a third party library called sqlora8. The library is not actively developed any more. Oracle support is now implemented using native Oracle Call Interface, which greatly improves performance and stability of Zabbix setups using Oracle as a back-end database.
Host status propagation from proxies
If a host is monitored by a proxy, status of the host will be correctly displayed and updated in Zabbix front-end.
Rotated logfile monitoring
Zabbix supports logfile monitoring, and version 1.8 improves it further. If an application is writing to a new logfile with varying name - for example, if logfile name includes date - it is much easier to monitor with Zabbix 1.8, as it is now possible to specify regular expressions in logfile monitoring.
Online documentation
Documentation from an inflexible PDF file has been converted to online format where anybody can comment on individual pages. Offline documentation can still be obtained with ODT export functionality.
Detailed availability information displaying
Instead of simply displaying generic host status, in 1.8 frontend three different monitoring methods have their status displayed - Zabbix agent, SNMP and IPMI.

Errors related to each method are stored separately and can be obtained by moving mouse cursor over the error icon.
Default theme uses green to denote availability, while Black&blue theme uses blue colour.
What's new in further releases
See detailed information on new features and significant changes in other 1.8 series releases:
Installation and upgrade
See the installation section for new installations.
See upgrading section if upgrading from an older Zabbix release.
Before upgrading, read important notes.