
2 Monitorar Windows amb l'agent Zabbix
Introducció
Aquesta pàgina us explica les passes que calen per iniciar el monitoratge bàsic de les màquines Windows amb Zabbix.
Per a qui adrecem aquesta guia
Aquesta guia és dissenyada per a usuaris nous de Zabbix i conté el conjunt mínim de les passes que calen per activar el monitoratge bàsic de la vostra màquina Windows. Si busqueu opcions de personalització complexes o necessiteu més configuracions avançades, veieu la secció Configuració del manual de Zabbix.
Requisits previs
Abans de continuar amb aquesta guia d'instal·lació, heu de descarregar i instal·lar el servidor Zabbix i la interfície Zabbix segons les instruccions del vostre sistema operatiu.
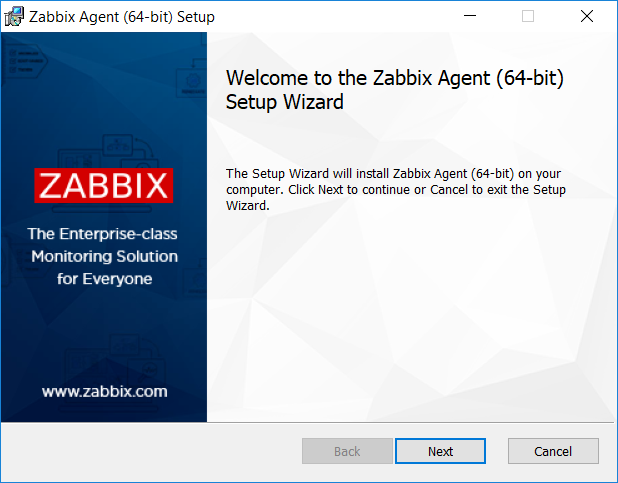
Instal·lar l'agent Zabbix
L'agent Zabbix és el procés responsable de la recollida de dades. Heu d'instal·lar-lo a la màquina Windows que vulgueu monitorar. Seguiu les instruccions d'instal·lació de l'agent Zabbix per a Windows.
Configura Zabbix per al monitoratge
L'agent Zabbix pot recollir mètriques en mode actiu o passiu (simultàniament).
Una comprovació passiva és una simple petició de dades. El servidor o proxy Zabbix demana algunes dades (per exemple, la càrrega de la CPU) i l'agent Zabbix retorna el resultat al servidor. Els controls actius requereixen un processament més complex. L'agent primer ha de recuperar des del servidor(s) una llista d'elements per al processament independent i, a continuació, enviar les dades de manera massiva. Veieu Comprovacions d'agent passiu i actiu per obtindre més informació.
Les plantilles de monitoratge proporcionades per Zabbix solen oferir dues alternatives: una plantilla per a l'agent de Zabbix i una plantilla per a l'Agent Zabbix (actiu). Amb la primera opció, l'agent recopilarà mètriques en mode passiu. Aquestes plantilles es lliuraran resultats de seguiment idèntics, però emprant protocols de comunicació diferents.
La configuració addicional de Zabbix depèn de si trieu una plantilla per a comprovacions actives o passives de l'agent Zabbix.
Comprovacions passives
Interfície Zabbix
1. Inicieu sessió a la interfície de Zabbix.
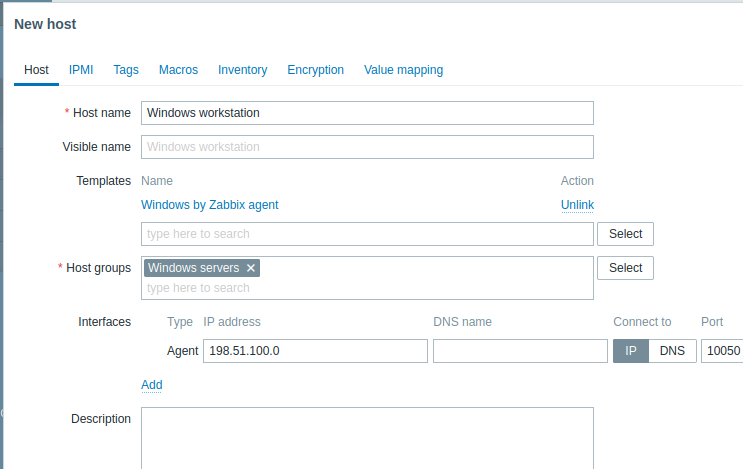
2. Crea un equip a la interfície web de Zabbix.
Aquest equip representarà la vostra màquina Windows.
3. Al paràmetre Interfaces, afegiu la interfície Agent i especifiqueu l'adreça IP o el nom DNS de la màquina Windows on és instal·lat l'agent.
4. Al paràmetre Plantilles, escriviu o trieu Windowsamb agent Zabbix.
Agent Zabbix
Per a comprovacions passives, l'agent Zabbix necessita sapiguer l'adreça IP o el nom DNS del servidor Zabbix. Si heu proporcionat la informació correcta durant la instal·lació de l'agent, el fitxer de configuració ja és actualitzat. En cas contrari, cal especificar-lo manualment. Aneu a la carpeta "C:\Program files\Zabbix Agent" i obriu el fitxer zabbix_agentd.conf i afegiu l'IP/DNS del vostre servidor Zabbix al paràmetre Server.
Exemple:
Server=192.0.2.22Comprovacions actives
Interfície Zabbix
1. Inicieu sessió a la interfície de Zabbix.
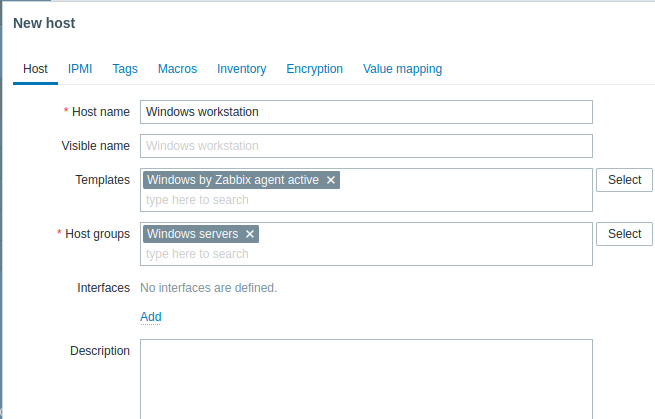
2. Crea un equip a la interfície web de Zabbix.
Aquest equiprepresentarà la vostra màquina Windows.
3. Al paràmetre Plantilles, escriviu o trieu Windows per agent actiu de Zabbix.
Agent Zabbix
A la carpeta "C:\Program files\Zabbix Agent" obriu el fitxer zabbix_agentd.conf i afegiu:
- El nom de l'equip que heu creat a la interfície web de Zabbix al paràmetre Hostname.
- L'adreça IP o el nom DNS de la vostra màquina servidor Zabbix al paràmetre ServerActive (potser ja ho teniu emplenat si l'heu proporcionat durant la configuració de l'agent Zabbix).
Exemple:
ServerActive= 192.0.2.22
Hostname=estació de treball Windows
Veure les mètriques recopilades
Felicitats! En aquest moment, Zabbix ja monitora la vostra màquina Windows.
Per veure les mètriques recollides, aneu a la secció Monitoratge->Equips del menú i feu clic a les darreres dades al costat de l'equip.

Configurar alertes de problemes
Zabbix us pot notificar sobre un problema de la vostra infraestructura mitjançant diversos mètodes. Aquesta guia ofereix les passes de configuració per enviar alertes per correu electrònic.
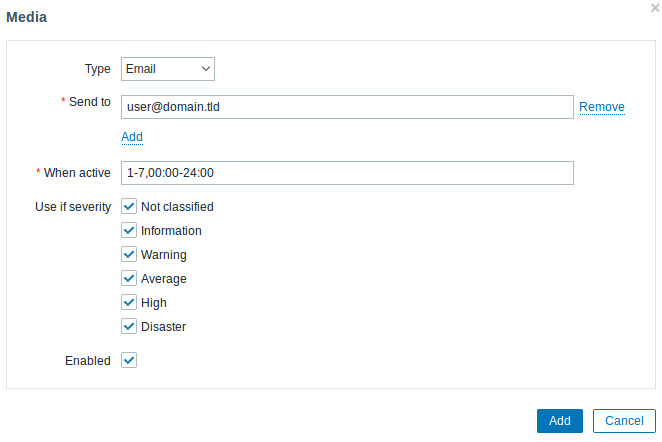
1. Aneu a Configuració de l'usuari -> Perfil, canvieu a la pestanya Suports i afegiu el vostre correu electrònic.
2. Seguiu la guia per a Rebre notificació de problemes.
El proper cop, quan Zabbix detecti un problema, hauríeu de rebre una alerta per correu electrònic.
A Windows, podeu emprar la utilitat CpuStres per simular una càrrega alta de CPU i, com a resultat, rebeu una alerta de problema.
Veieu també:
- Creació d'un element - com començar a monitorar mètriques addicionals (monitoratge personalitzat sense plantilles).
- Elements de l'agent Zabbix, Elements de l'agent Zabbix per a Windows - llistat complet de mètriques que podeu monitorar amb l'agent de Zabbix a Windows.
- Escalades de problemes - com crear escenaris d'alerta de diverses passes (p. ex., primer enviar missatge a l'administrador del sistema i després, si un problema no es resol en 45 minuts, enviar missatge al gestor del centre de dades).
2. Monitor Windows with Zabbix agent
Introduction
This page walks you through the steps required to start basic monitoring of Windows machines with Zabbix.
Who this guide is for
This guide is designed for new Zabbix users and contains the minimum set of steps required to enable basic monitoring of your Windows machine. If you are looking for deep customization options or require more advanced configuration, see Configuration section of Zabbix manual.
Prerequisites
Before proceeding with this installation guide, you must download and install Zabbix server and Zabbix frontend according to instructions for your OS.
Install Zabbix agent
Zabbix agent is the process responsible for gathering data. You need to install it on the Windows machine that you want to monitor. Follow Zabbix agent installation instructions for Windows.
Configure Zabbix for monitoring
Zabbix agent can collect metrics in active or passive mode (simultaneously).
A passive check is a simple data request. Zabbix server or proxy asks for some data (for example, CPU load) and Zabbix agent sends back the result to the server. Active checks require more complex processing. The agent must first retrieve from the server(s) a list of items for independent processing and then bulk send the data back. See Passive and active agent checks for more info.
Monitoring templates provided by Zabbix usually offer two alternatives - a template for Zabbix agent and a template for Zabbix agent (active). With the first option, the agent will collect metrics in passive mode. Such templates will deliver identical monitoring results, but using different communication protocols.
Further Zabbix configuration depends on whether you select a template for active or passive Zabbix agent checks.
Passive checks
Zabbix frontend
1. Log in to Zabbix frontend.
2. Create a host in Zabbix web interface.
This host will represent your Windows machine.
3. In the Interfaces parameter, add Agent interface and specify the IP address or DNS name of the Windows machine where the agent is installed.
4. In the Templates parameter, type or select Windows by Zabbix agent.
Zabbix agent
For passive checks Zabbix agent needs to know the IP address or DNS name of Zabbix server. If you
have provided correct information during the agent installation, the configuration file is already updated. Otherwise, you
need to manually specify it. Go to the C:\Program files\Zabbix Agent folder, open the file
zabbix_agent.conf and add the IP/DNS of your Zabbix server to the Server parameter.
Example:
Server=192.0.2.22Active checks
Zabbix frontend
1. Log in to Zabbix frontend.
2. Create a host in Zabbix web interface.
This host will represent your Windows machine.
3. In the Templates parameter, type or select Windows by Zabbix agent active.
Zabbix agent
In the C:\Program files\Zabbix Agent folder open the file zabbix_agent.conf and add:
- The name of the host you created in Zabbix web interface to the Hostname parameter.
- The IP address or DNS name of your Zabbix server machine to the ServerActive parameter (might be prefilled if you have provided it during Zabbix agent setup).
Example:
ServerActive= 192.0.2.22
Hostname="Windows workstation"
View collected metrics
Congratulations! At this point, Zabbix is already monitoring your Windows machine.
To view collected metrics, open the Monitoring->Hosts menu section and click on the Latest data next to the host.
Set up problem alerts
Zabbix can notify you about a problem with your infrastructure using a variety of methods. This guide provides configuration steps for sending email alerts.
1. Go to the User settings -> Profile, switch to the tab Media and add your email.
2. Follow the guide for Receiving problem notification.
Next time, when Zabbix detects a problem you should receive an alert via email.
On Windows, you can use CpuStres utility to simulate high CPU load and as a result receive a problem alert.
See also:
- Creating an item - how to start monitoring additional metrics (custom monitoring without templates).
- Zabbix agent items, Zabbix agent items for Windows - full list of metrics you can monitor using Zabbix agent on Windows.
- Problem escalations - how to create multi-step alert scenarios (e.g., first send message to the system administrator, then, if a problem is not resolved in 45 minutes, send message to the data center manager).