
Creazione di nomi personalizzati per i contatori di prestazioni per VMware
Panoramica
Il percorso del contatore di prestazioni VMware ha il formato
group/counter[rollup] in cui:
group- il gruppo del contatore di prestazioni, ad esempio, cpucounter- il nome del contatore di prestazioni, ad esempio, usagemhzrollup- il tipo di rollup del contatore di prestazioni, ad esempio, average
Quindi l'esempio sopra fornirebbe il seguente percorso del contatore:
cpu/usagemhz[average]
Le descrizioni dei gruppi di contatori di prestazioni, i nomi dei contatori e i tipi di rollup possono essere trovati nella documentazione VMware.
È possibile ottenere i nomi interni e creare nomi personalizzati dei contatori di prestazioni utilizzando un item di tipo script in Zabbix.
Configurazione
- Creare un item Script disabilitato sull'host VMware principale (dove è presente l'item eventlog[]) con i seguenti parametri:
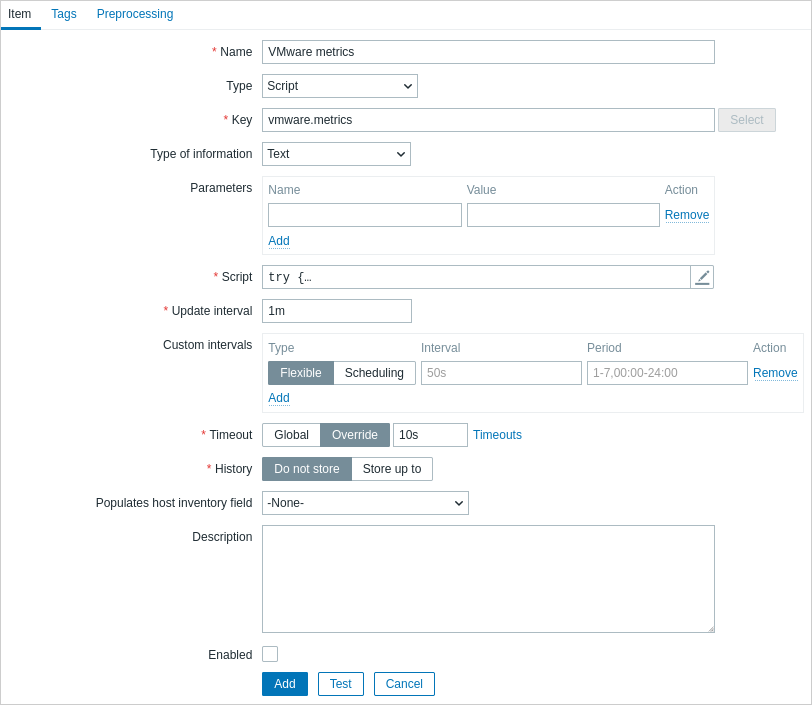
- Name: VMware metrics
- Type: Script
- Key: vmware.metrics
- Type of information: Text
- Script: copia e incolla lo script riportato di seguito
- Timeout: 10
- History: Do not store
- Enabled: non selezionato
Script
try {
    Zabbix.log(4, 'vmware metrics script');

    var result, resp,
    req = new HttpRequest();
    req.addHeader('Content-Type: application/xml');
    req.addHeader('SOAPAction: "urn:vim25/6.0"');

    login = '<soapenv:Envelope xmlns:soapenv="http://schemas.xmlsoap.org/soap/envelope/" xmlns:urn="urn:vim25">\
    <soapenv:Header/>\
    <soapenv:Body>\
        <urn:Login>\
            <urn:_this type="SessionManager">SessionManager</urn:_this>\
            <urn:userName>{$VMWARE.USERNAME}</urn:userName>\
            <urn:password>{$VMWARE.PASSWORD}</urn:password>\
        </urn:Login>\
    </soapenv:Body>\
</soapenv:Envelope>'
    resp = req.post("{$VMWARE.URL}", login);
    if (req.getStatus() != 200) {
        throw 'Response code: '+req.getStatus();
    }

    query = '<soapenv:Envelope xmlns:soapenv="http://schemas.xmlsoap.org/soap/envelope/" xmlns:urn="urn:vim25">\
<soapenv:Header/>\
    <soapenv:Body>\
        <urn:RetrieveProperties>\
            <urn:_this type="PropertyCollector">propertyCollector</urn:_this>\
            <urn:specSet>\
                <urn:propSet>\
                   <urn:type>PerformanceManager</urn:type>\
                   <urn:pathSet>perfCounter</urn:pathSet>\
                </urn:propSet>\
                <urn:objectSet>\
                   <urn:obj type="PerformanceManager">PerfMgr</urn:obj>\
                </urn:objectSet>\
            </urn:specSet>\
        </urn:RetrieveProperties>\
    </soapenv:Body>\
</soapenv:Envelope>'
    resp = req.post("{$VMWARE.URL}", query);
    if (req.getStatus() != 200) {
        throw 'Response code: '+req.getStatus();
    }
    Zabbix.log(4, 'vmware metrics=' + resp);
    result = resp;

    logout = '<soapenv:Envelope xmlns:soapenv="http://schemas.xmlsoap.org/soap/envelope/" xmlns:urn="urn:vim25">\
    <soapenv:Header/>\
    <soapenv:Body>\
        <urn:Logout>\
            <urn:_this type="SessionManager">SessionManager</urn:_this>\
        </urn:Logout>\
    </soapenv:Body>\
</soapenv:Envelope>'

    resp = req.post("{$VMWARE.URL}",logout);
    if (req.getStatus() != 200) {
        throw 'Response code: '+req.getStatus();
    }

} catch (error) {
    Zabbix.log(4, 'vmware call failed : '+error);
    result = {};
}

return result;
Una volta configurato l'item, fare clic sul pulsante Test, quindi su Get value.
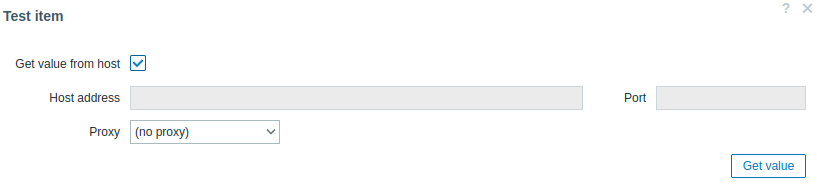
Copiare l'XML ricevuto in un qualsiasi formatter XML e individuare la metrica desiderata.
Un esempio di XML per una metrica:
<PerfCounterInfo xsi:type="PerfCounterInfo">
    <key>6</key>
    <nameInfo>
        <label>Usage in MHz</label>
        <summary>CPU usage in megahertz during the interval</summary>
        <key>usagemhz</key>
    </nameInfo>
    <groupInfo>
        <label>CPU</label>
        <summary>CPU</summary>
        <key>cpu</key>
    </groupInfo>
    <unitInfo>
        <label>MHz</label>
        <summary>Megahertz</summary>
        <key>megaHertz</key>
    </unitInfo>
    <rollupType>average</rollupType>
    <statsType>rate</statsType>
    <level>1</level>
    <perDeviceLevel>3</perDeviceLevel>
</PerfCounterInfo>
Usare XPath per estrarre il percorso del counter dall'XML ricevuto. Per l'esempio sopra, l'XPath sarà:
| field | xPath | value |
|---|---|---|
| group | //groupInfo[../key=6]/key | cpu |
| counter | //nameInfo[../key=6]/key | usagemhz |
| rollup | //rollupType[../key=6] | average |
Il percorso risultante del performance counter in questo caso è: cpu/usagemhz[average]