Widgets del dashboard
Descripción general
Zabbix proporciona una variedad de widgets de panel que visualizan y resumen los datos de monitoreo, brindándole una visión clara del rendimiento y la disponibilidad del sistema.
A continuación se muestra una descripción general de todos los widgets, agrupados según su propósito principal.
Para obtener detalles sobre la configuración de los widgets, consulte Parámetros de los widgets del panel.
Visualización de datos
Estos widgets presentan datos en varios formatos visuales, ayudándole a supervisar datos y problemas de diferentes maneras.
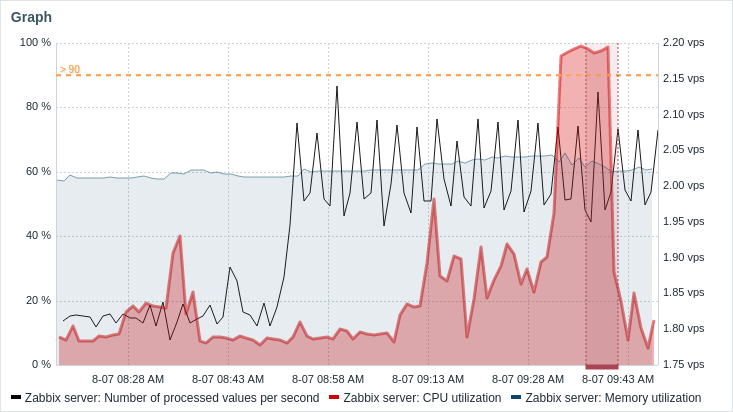
Gráfico
El widget Gráfico muestra los datos numéricos de un item como un gráfico vectorial. Puede ayudarle a realizar un seguimiento de las métricas, detectar problemas y comparar valores a lo largo del tiempo y entre hosts.
Consulte también:
- Gráfico (clásico): el widget Gráfico heredado que muestra los datos numéricos de un item como un gráfico basado en imágenes.
- Prototipo de gráfico: muestra una cuadrícula de gráficos personalizados creados automáticamente basados en prototipos de gráficos de reglas de bajo nivel de descubrimiento o prototipos de item.
- Gráficos favoritos: muestra una lista alfabética de accesos directos a los gráficos marcados como favoritos por el usuario actual.
Gráfico de dispersión
El widget Gráfico de dispersión muestra la relación entre dos métricas trazando puntos de datos individuales a lo largo de un eje X e Y. Esto ayuda a revelar patrones, agrupaciones, correlaciones y valores atípicos en el conjunto de datos.

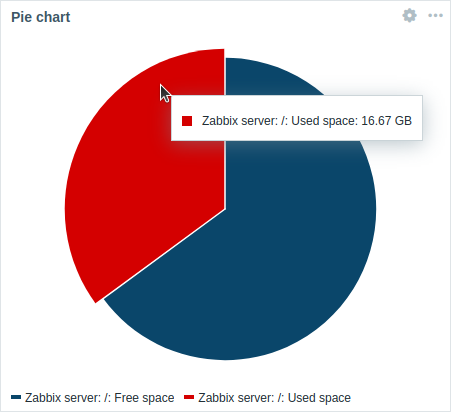
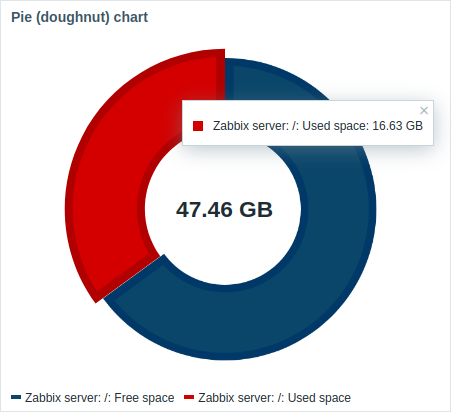
Gráfico circular
El widget Gráfico circular muestra datos numéricos de elementos como un gráfico circular o de anillo basado en vectores. Este widget puede ayudarle a visualizar cómo los elementos o los hosts contribuyen al conjunto de datos general.
 |
 |
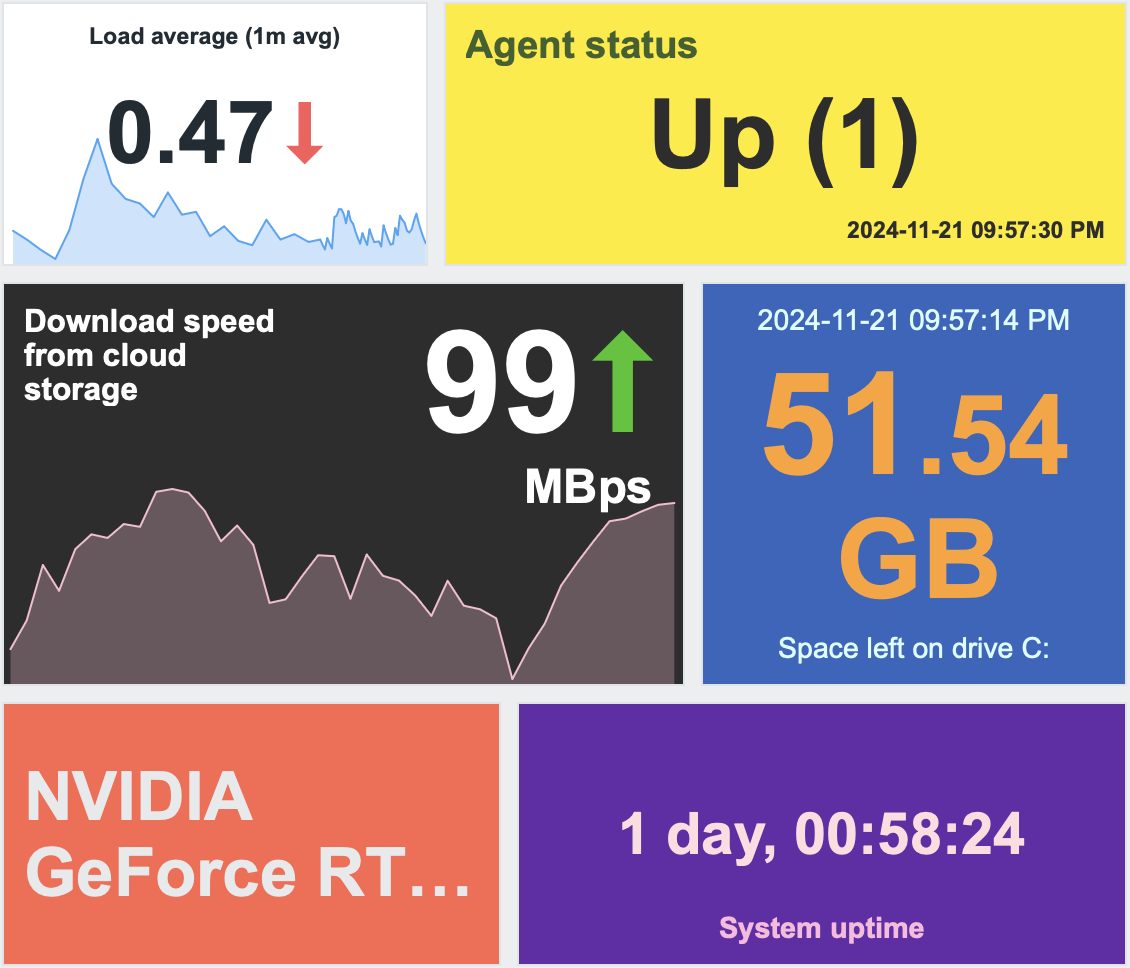
Medidor/Valor de elemento
Los widgets de Medidor/Valor de elemento muestran el valor de un único elemento, lo que resulta útil para vigilar métricas importantes, visualizar umbrales y detectar cambios repentinos en los datos.
Widget de medidor:
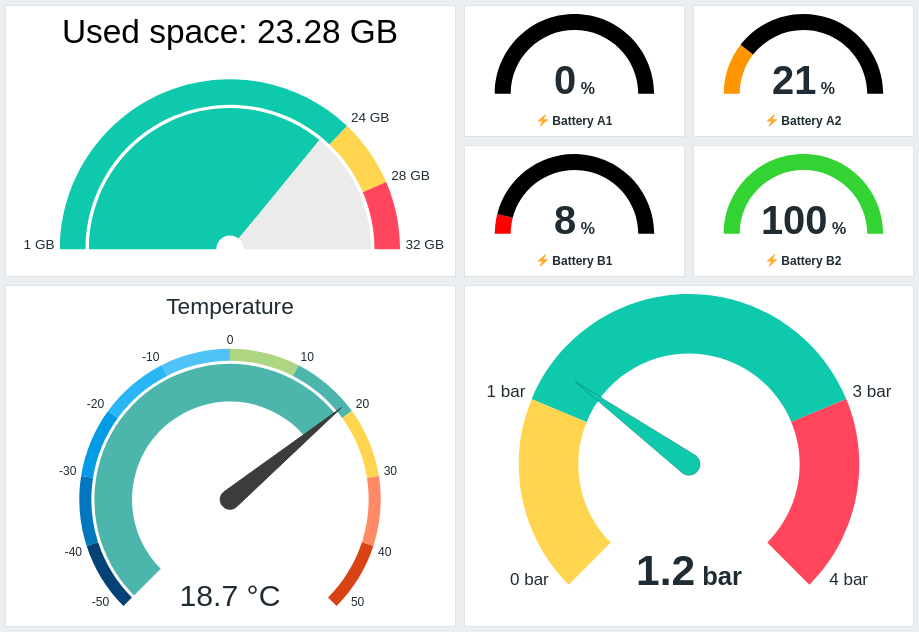
Widget de valor de elemento:
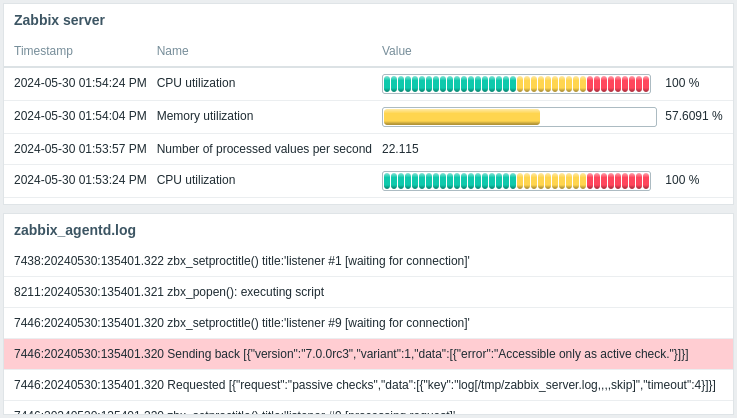
Historial de ítem
El widget Historial de ítem muestra los datos más recientes de todos los tipos de ítems (numéricos, texto, etc.) en formato de tabla. Puede mostrar barras de progreso e imágenes (útil para ítems de navegador) y puede resaltar valores (útil para la monitorización de archivos de registro).
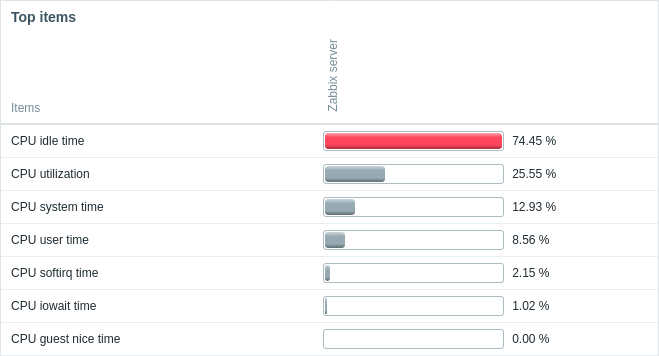
Principales items
El widget Principales items muestra los valores más altos/bajos para los items seleccionados, proporcionando una visión rápida de su rendimiento.
Ver también:
- Principales hosts: muestra los valores más altos/bajos para los items seleccionados de varios hosts.
- Principales triggers: muestra los triggers con el mayor número de problemas.
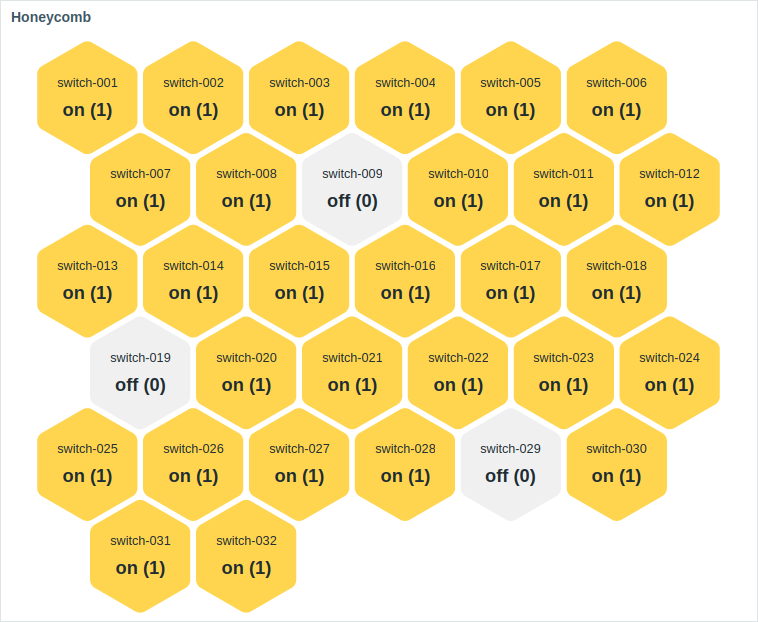
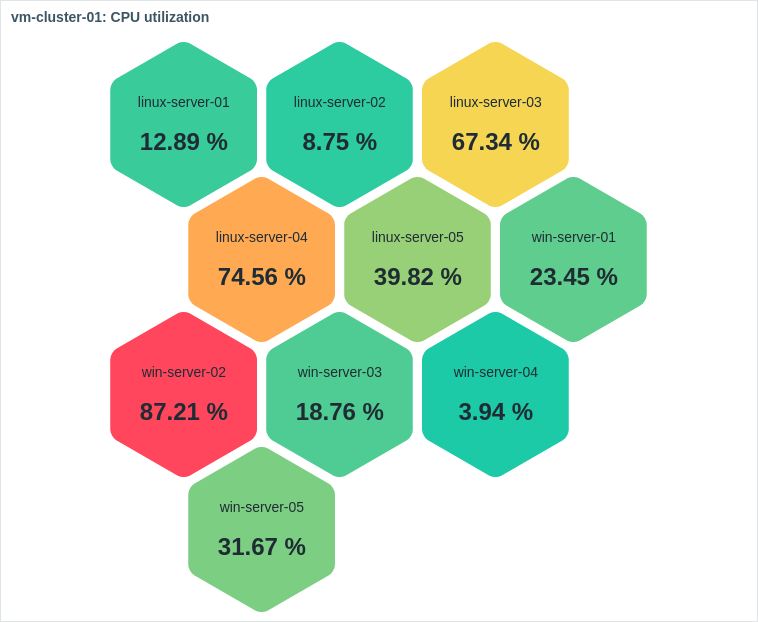
Panal de abeja
El widget Panal de abeja muestra equipos o elementos como celdas hexagonales en una cuadrícula. Este diseño facilita la detección de equipos/elementos problemáticos, la identificación de agrupaciones de problemas, la comparación de grupos de un vistazo y mucho más.
 |
 |
Mapas
Los widgets de mapas visualizan la topología de la red o la ubicación de los equipos, ayudando a evaluar el estado general y específico por ubicación.
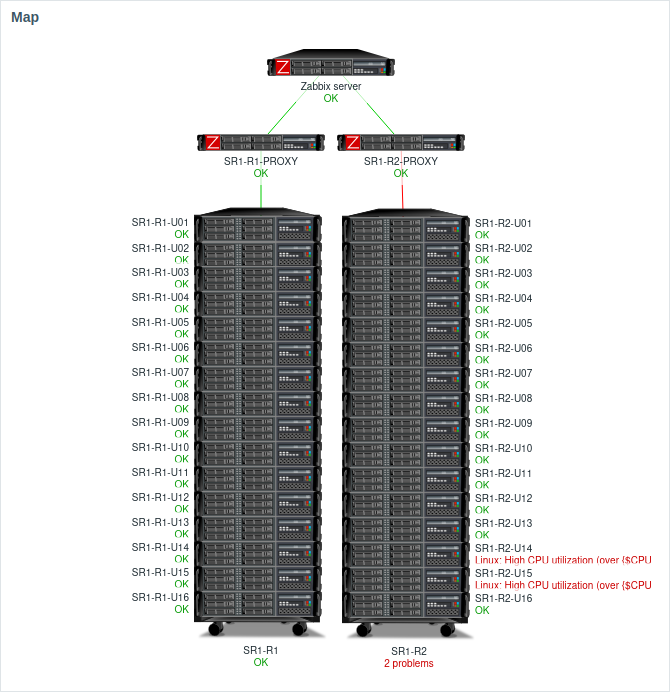
Mapa
El widget Mapa puede mostrar un mapa de red o una visualización similar, proporcionándole una visión dinámica de su red.
Véase también:
- Árbol de navegación de mapas: muestra una jerarquía de mapas existentes y el recuento de problemas para cada mapa y grupo de mapas.
- Mapas favoritos: muestra una lista de accesos directos a los mapas marcados como favoritos por el usuario actual, ordenados alfabéticamente.
Geomapa
El widget Geomapa muestra los equipos como marcadores en un mapa interactivo basado en Leaflet, con colores de marcador que indican el problema más grave de cada equipo.

Detalles de Host/Elemento
Estos widgets proporcionan listas y vistas detalladas de hosts o elementos.
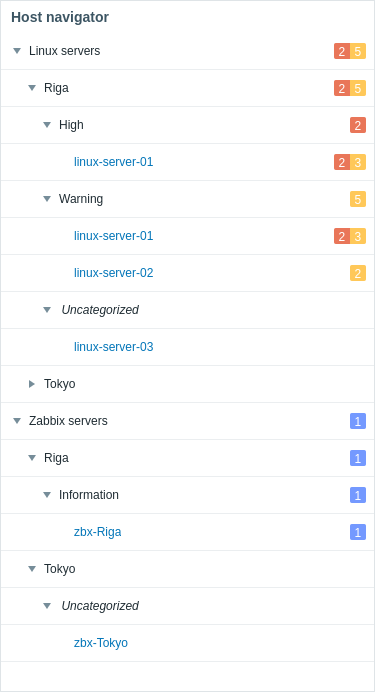
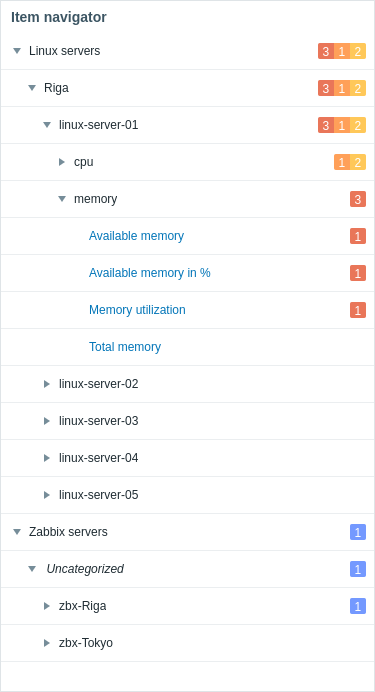
Navegador de equipos/elementos
Los widgets Navegador de equipos/Navegador de elementos muestran una lista de equipos/elementos basada en varias opciones de filtrado y agrupamiento. Estos widgets son más útiles para controlar lo que muestran otros widgets en función del equipo/elemento seleccionado.
 |
 |
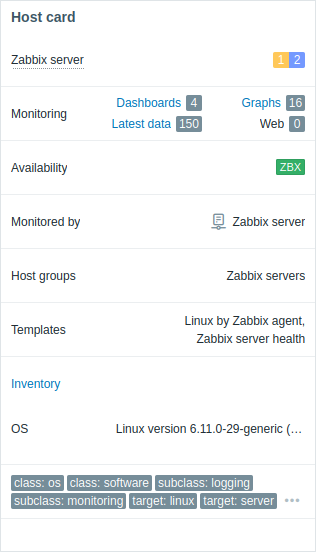
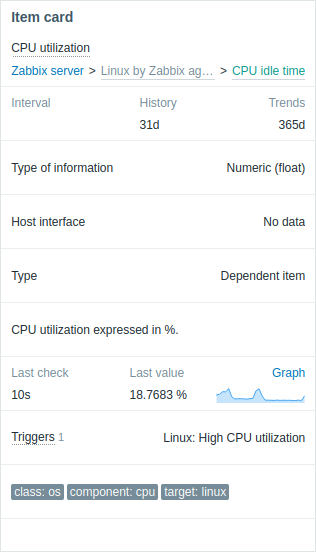
Tarjeta de Equipo/Elemento
Los widgets de Tarjeta de equipo/Tarjeta de elemento muestran detalles de un único equipo/elemento, lo que le permite evaluar rápidamente el estado y la configuración de un equipo o elemento (disponibilidad del equipo, problemas, inventario, últimos datos del elemento, errores, descripción, etc.).
 |
 |
Estado e informes
Estos widgets muestran datos de estado (por ejemplo, disponibilidad, disparadores, problemas) así como informes.
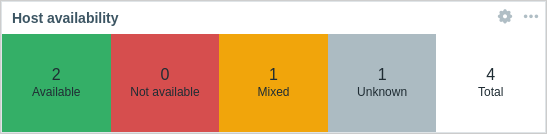
Disponibilidad de equipos
El widget Disponibilidad de equipos muestra la disponibilidad de los equipos en los grupos seleccionados, lo que le permite supervisar el número de equipos que están activos o inactivos.
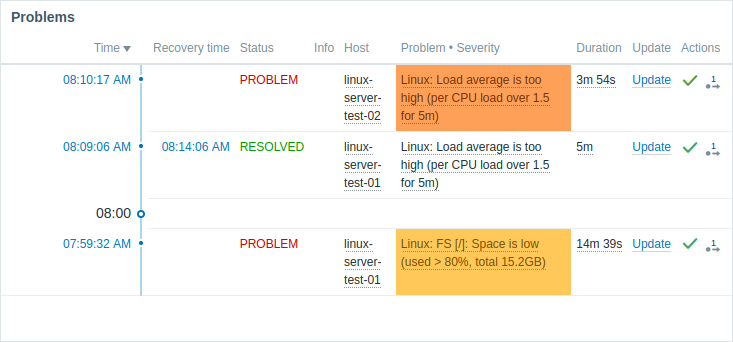
Problemas
El widget Problemas muestra los problemas actuales filtrados por diferentes parámetros (grupos de hosts, hosts, nombres de problemas, etc.), dándole una visión clara de lo que necesita atención.
Vea también:
- Problemas por severidad: muestra el número de problemas raíz agrupados por severidad.
- Hosts con problemas: muestra el número de problemas raíz por grupo de hosts y muestra la mayor severidad de problema en cada grupo.
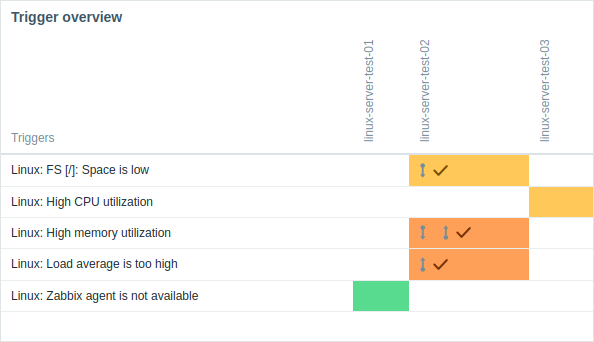
Resumen de disparadores
El widget Resumen de disparadores muestra los estados actuales de los disparadores de los equipos como una tabla de bloques de colores. Proporciona una visión rápida y visual del estado y la actividad de los disparadores en diferentes equipos.
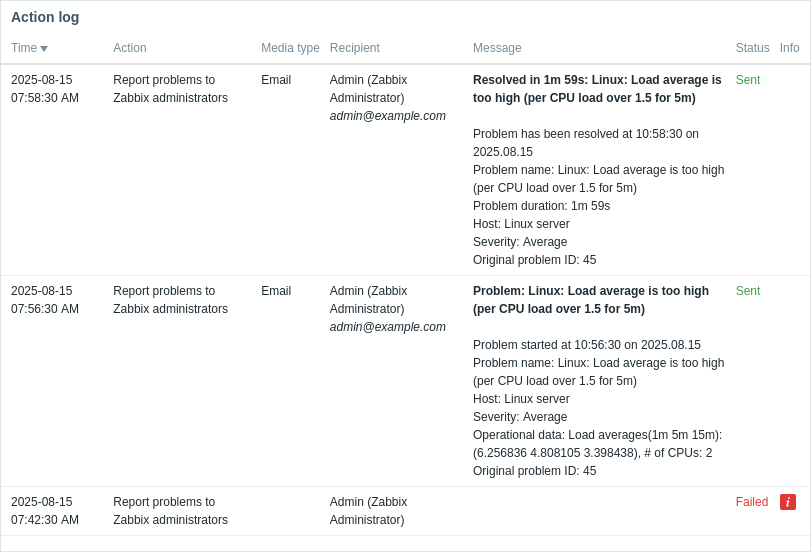
Registro de acciones
El widget Registro de acciones muestra detalles de las operaciones (notificaciones, comandos remotos) ejecutadas dentro de una acción. El registro detallado ayuda con la auditoría, la resolución de problemas y el monitoreo de la ejecución de cada acción.
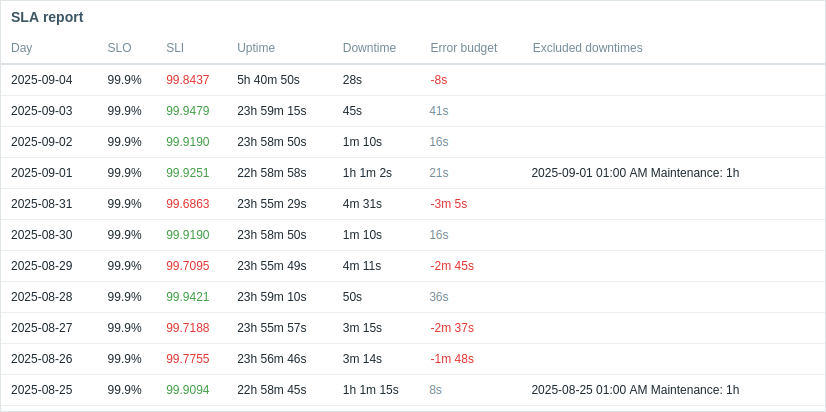
Informe de SLA
El widget de informe de SLA muestra informes de SLA, ayudándole a supervisar el rendimiento del servicio en comparación con los objetivos definidos.
Supervisión web
El widget de Supervisión web muestra el estado de los escenarios web activos.

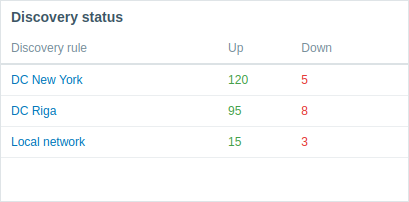
Estado de descubrimiento
El widget Estado de descubrimiento muestra el estado de los dispositivos descubiertos por las reglas de descubrimiento de red habilitadas. Le ayuda a supervisar si el descubrimiento de red funciona correctamente y el número de dispositivos que están activos o inactivos.
Utilidades del panel e información del sistema
Estos widgets proporcionan información y herramientas complementarias para mejorar sus paneles.
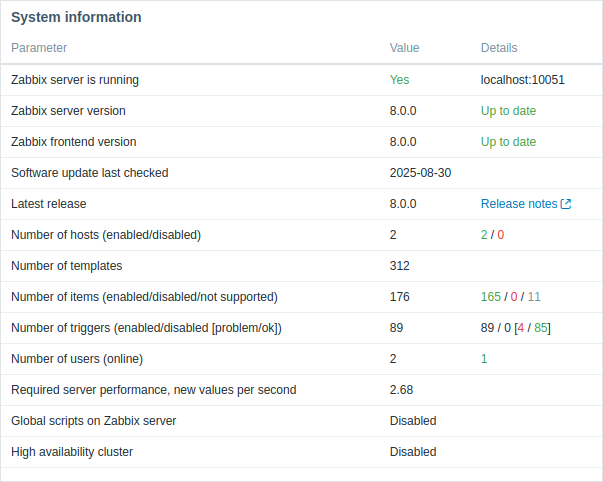
Información del sistema
El widget Información del sistema muestra un resumen de los datos clave del servidor Zabbix y del sistema o detalles de los nodos de alta disponibilidad.
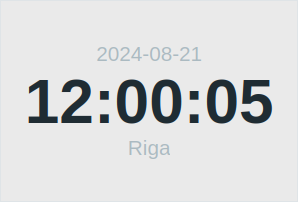
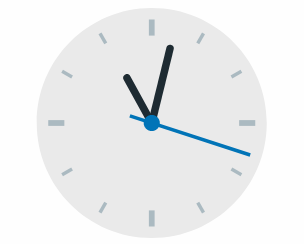
Reloj
El widget Reloj muestra la hora local, del servidor o del equipo en formato analógico o digital.
 |
 |
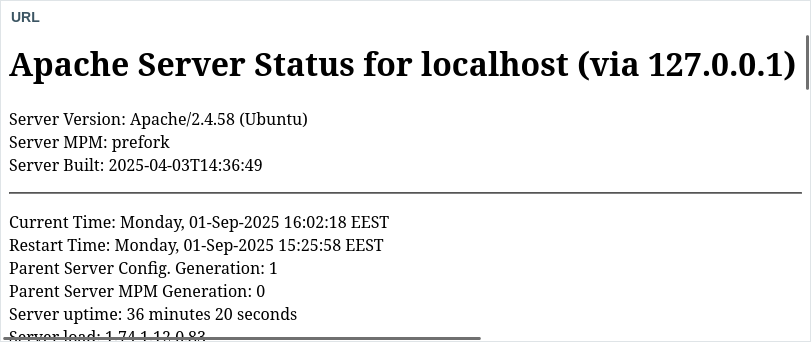
URL
El widget URL muestra el contenido recuperado de una URL.