
7 Cuadros de mando
Resumen
Los dashboards se exportan con todos los objetos relacionados y las relaciones entre objetos.
Exportación
Para exportar dashboards, haga lo siguiente:
- Vaya a Dashboards > Todos los dashboards.
- Marque las casillas de verificación de los dashboards que desea exportar.
- Haga clic en Exportar debajo de la lista.
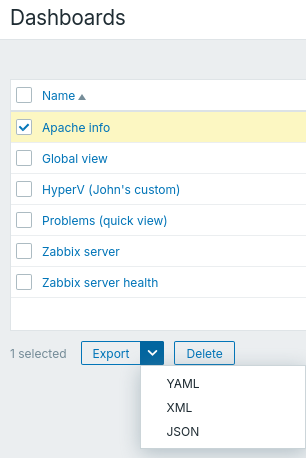
Según el formato seleccionado, los dashboards se exportan a un archivo local con un nombre predeterminado:
zbx_export_dashboards.yaml- en la exportación YAML (opción predeterminada para la exportación);zbx_export_dashboards.xml- en la exportación XML;zbx_export_dashboards.json- en la exportación JSON.
Importación
Para importar dashboards, haga lo siguiente:
- Vaya a Dashboards > All dashboards.
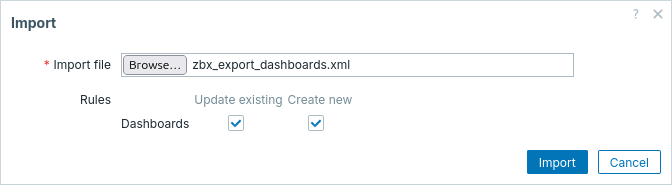
- Haga clic en Import en la esquina superior derecha.
- Seleccione el archivo de importación.
- Marque las opciones necesarias en las reglas de importación.
- Haga clic en Import en la esquina inferior derecha del formulario de configuración.
Reglas de importación:
| Regla | Descripción |
|---|---|
| Update existing | Los elementos existentes se actualizarán utilizando los datos del archivo de importación. De lo contrario, no se actualizarán. |
| Create new | Se crearán nuevos elementos utilizando los datos del archivo de importación. De lo contrario, no se crearán. |
En la siguiente pantalla, podrá ver el contenido de los dashboards que se están importando. Si se trata de un dashboard nuevo, todos los elementos aparecerán en verde. Si se actualiza un dashboard existente, los nuevos elementos del dashboard se resaltarán en verde; los elementos eliminados del dashboard se resaltarán en rojo; los elementos que no hayan cambiado aparecerán sobre un fondo gris.
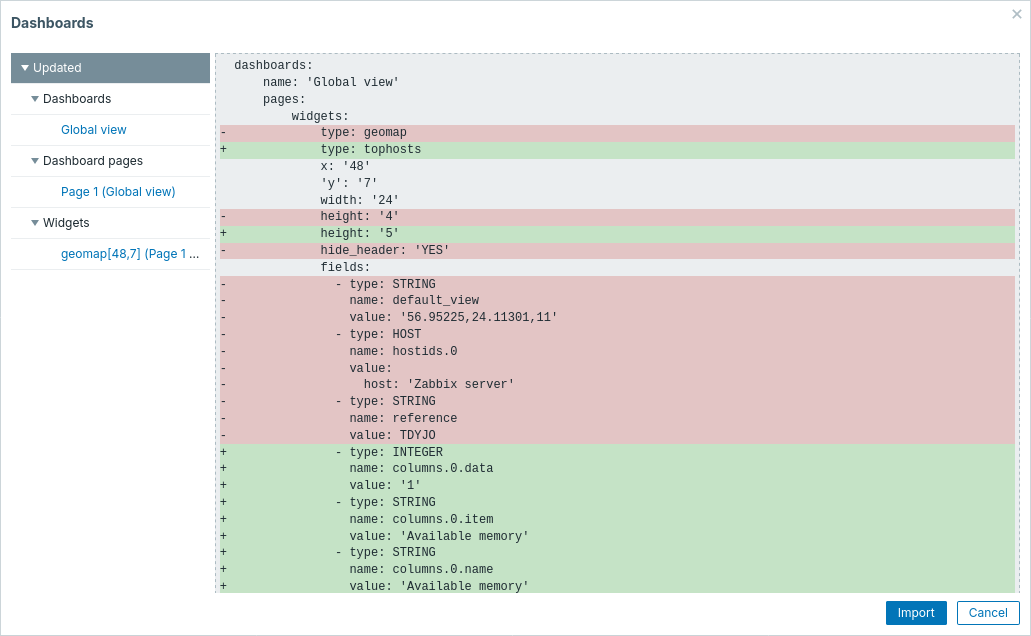
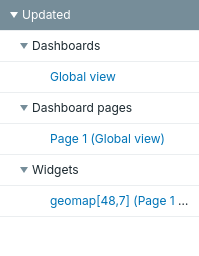
El menú de la izquierda puede utilizarse para navegar por la lista de cambios. La sección Updated resalta todos los cambios realizados en los elementos existentes del dashboard. La sección Added enumera los nuevos elementos del dashboard. Los elementos de cada sección se agrupan por tipo de elemento; haga clic en la flecha gris para expandir o contraer el grupo de elementos.
Revise los cambios del dashboard y luego haga clic en Import para realizar la importación del dashboard. En el frontend se mostrará un mensaje indicando si la importación se realizó correctamente o si falló.
Formato de exportación
Exportar a YAML:
zabbix_export:
version: '8.0'
dashboards:
- name: 'Vista global'
pages:
- widgets:
- type: tophosts
name: 'Hosts principales por utilización de CPU'
width: '25'
height: '4'
fields:
- type: INTEGER
name: column
value: '1'
- type: INTEGER
name: columns.0.data
value: '2'
- type: STRING
name: columns.0.item
value: 'Nombre del sistema'
- type: STRING
name: columns.0.name
value: 'Nombre del host'
- type: STRING
name: columns.1.base_color
value: 4CAF50
- type: INTEGER
name: columns.1.data
value: '1'
- type: INTEGER
name: columns.1.display
value: '3'
- type: STRING
name: columns.1.item
value: 'Utilización de CPU'
- type: STRING
name: columns.1.max
value: '100'
- type: STRING
name: columns.1.min
value: '0'
- type: STRING
name: columns.1.name
value: Utilización
- type: INTEGER
name: columns.2.data
value: '1'
- type: STRING
name: columns.2.item
value: 'Promedio de carga (prom. 1m)'
- type: STRING
name: columns.2.name
value: 'prom. 1m'
- type: INTEGER
name: columns.3.data
value: '1'
- type: STRING
name: columns.3.item
value: 'Promedio de carga (prom. 5m)'
- type: STRING
name: columns.3.name
value: 'prom. 5m'
- type: INTEGER
name: columns.4.data
value: '1'
- type: STRING
name: columns.4.item
value: 'Promedio de carga (prom. 15m)'
- type: STRING
name: columns.4.name
value: 'prom. 15m'
- type: INTEGER
name: columns.5.data
value: '1'
- type: INTEGER
name: columns.5.decimal_places
value: '0'
- type: STRING
name: columns.5.item
value: 'Número de procesos'
- type: STRING
name: columns.5.name
value: Procesos
- type: STRING
name: columnsthresholds.1.color.0
value: FFFF00
- type: STRING
name: columnsthresholds.1.color.1
value: FF8000
- type: STRING
name: columnsthresholds.1.color.2
value: FF4000
- type: STRING
name: columnsthresholds.1.threshold.0
value: '50'
- type: STRING
name: columnsthresholds.1.threshold.1
value: '80'
- type: STRING
name: columnsthresholds.1.threshold.2
value: '90'
- type: STRING
name: reference
value: NLVMO
- type: hostavail
'y': '4'
width: '25'
fields:
- type: INTEGER
name: interface_type.0
value: '1'
- type: problems
name: 'Problemas actuales'
'y': '6'
width: '48'
height: '5'
fields:
- type: STRING
name: reference
value: BRUQE
- type: INTEGER
name: show
value: '3'
- type: INTEGER
name: show_tags
value: '3'
- type: systeminfo
x: '25'
width: '23'
height: '4'
- type: problemsbysv
name: 'Problemas por gravedad'
x: '25'
'y': '4'
width: '23'
fields:
- type: STRING
name: reference
value: LBSVB
- type: INTEGER
name: show_type
value: '1'
- type: gauge
name: 'server Zabbix'
x: '48'
width: '12'
height: '4'
hide_header: 'YES'
fields:
- type: INTEGER
name: angle
value: '270'
- type: INTEGER
name: desc_size
value: '8'
- type: ITEM
name: itemid.0
value:
host: 'Zabbix server'
key: vm.memory.utilization
- type: STRING
name: max
value: '100'
- type: STRING
name: min
value: '0'
- type: INTEGER
name: scale_size
value: '11'
- type: INTEGER
name: show.0
value: '1'
- type: INTEGER
name: show.1
value: '2'
- type: INTEGER
name: show.2
value: '3'
- type: INTEGER
name: show.3
value: '4'
- type: INTEGER
name: show.4
value: '5'
- type: STRING
name: thresholds.0.color
value: 42A5F5
- type: STRING
name: thresholds.0.threshold
value: '0'
- type: STRING
name: thresholds.1.color
value: 9CCC65
- type: STRING
name: thresholds.1.threshold
value: '20'
- type: STRING
name: thresholds.2.color
value: FFEE58
- type: STRING
name: thresholds.2.threshold
value: '40'
- type: STRING
name: thresholds.3.color
value: FFA726
- type: STRING
name: thresholds.3.threshold
value: '60'
- type: STRING
name: thresholds.4.color
value: FF7043
- type: STRING
name: thresholds.4.threshold
value: '80'
- type: INTEGER
name: th_arc_size
value: '9'
- type: INTEGER
name: th_show_arc
value: '1'
- type: INTEGER
name: th_show_labels
value: '1'
- type: INTEGER
name: units_bold
value: '1'
- type: INTEGER
name: units_size
value: '24'
- type: INTEGER
name: value_arc_size
value: '30'
- type: INTEGER
name: value_bold
value: '1'
- type: INTEGER
name: value_size
value: '24'
- type: svggraph
x: '48'
'y': '4'
width: '24'
height: '3'
hide_header: 'YES'
fields:
- type: INTEGER
name: axisx
value: '0'
- type: STRING
name: ds.0.color
value: AB47BC
- type: INTEGER
name: ds.0.fill
value: '0'
- type: STRING
name: ds.0.hosts.0
value: 'Zabbix server'
- type: STRING
name: ds.0.items.0
value: 'Memoria disponible'
- type: INTEGER
name: ds.0.transparency
value: '2'
- type: INTEGER
name: ds.0.type
value: '2'
- type: INTEGER
name: ds.0.width
value: '2'
- type: INTEGER
name: ds.1.axisy
value: '1'
- type: STRING
name: ds.1.color
value: 42A5F5
- type: INTEGER
name: ds.1.fill
value: '0'
- type: STRING
name: ds.1.hosts.0
value: 'Zabbix server'
- type: STRING
name: ds.1.items.0
value: 'Utilización de CPU'
- type: INTEGER
name: ds.1.transparency
value: '0'
- type: INTEGER
name: ds.1.type
value: '2'
- type: INTEGER
name: ds.1.width
value: '2'
- type: STRING
name: reference
value: TOYGS
- type: geomap
x: '48'
'y': '7'
width: '24'
height: '4'
hide_header: 'YES'
fields:
- type: STRING
name: default_view
value: '56.95225,24.11301,11'
- type: HOST
name: hostids.0
value:
host: 'Zabbix server'
- type: STRING
name: reference
value: TDYJO
- type: clock
name: 'Hora local'
x: '60'
width: '12'
hide_header: 'YES'
fields:
- type: INTEGER
name: clock_type
value: '1'
- type: INTEGER
name: show.0
value: '1'
- type: INTEGER
name: show.1
value: '2'
- type: INTEGER
name: show.2
value: '3'
- type: INTEGER
name: time_sec
value: '0'
- type: INTEGER
name: tzone_format
value: '1'
- type: item
name: 'Rendimiento del server'
x: '60'
'y': '2'
width: '12'
hide_header: 'YES'
fields:
- type: INTEGER
name: aggregate_function
value: '2'
- type: INTEGER
name: decimal_size
value: '32'
- type: STRING
name: description
value: 'Valores por segundo'
- type: INTEGER
name: desc_h_pos
value: '0'
- type: INTEGER
name: desc_v_pos
value: '0'
- type: ITEM
name: itemid.0
value:
host: 'Zabbix server'
key: 'zabbix[wcache,values]'
- type: INTEGER
name: show.0
value: '1'
- type: INTEGER
name: show.1
value: '2'
- type: INTEGER
name: show.2
value: '5'
- type: INTEGER
name: sparkline.fill
value: '2'
- type: INTEGER
name: sparkline.width
value: '2'
- type: STRING
name: thresholds.0.color
value: DCEDC8
- type: STRING
name: thresholds.0.threshold
value: '20'
- type: STRING
name: thresholds.1.color
value: FFF9C4
- type: STRING
name: thresholds.1.threshold
value: '40'
- type: STRING
name: thresholds.2.color
value: FFCCBC
- type: STRING
name: thresholds.2.threshold
value: '60'
- type: INTEGER
name: units_bold
value: '0'
- type: INTEGER
name: units_show
value: '0'
- type: INTEGER
name: value_h_pos
value: '0'
- type: INTEGER
name: value_size
value: '32'Elementos exportados
Los elementos exportados se explican en la tabla siguiente.
| Elemento | Tipo | Descripción | |
|---|---|---|---|
| name | string | (obligatorio) Nombre del dashboard. | |
| pages | Elemento raíz para las páginas del dashboard | ||
| widgets | Elemento raíz para las páginas del dashboard | ||
Véase también: Dashboard object (consulte la propiedad correspondiente con el mismo nombre).
Widget del dashboard
| Element | Type | Description |
|---|---|---|
| type | string | (obligatorio) Tipo del widget del dashboard. Valores posibles: actionlog - Registro de acciones; clock - Reloj; discovery - Estado de descubrimiento; favgraphs - Gráficos favoritos; favmaps - Mapas favoritos; gauge - Medidor; geomap - Geomapa; graph - Gráfico (clásico); graphprototype - Prototipo de gráfico; honeycomb - Panal; hostavail - Disponibilidad del host; hostcard - Tarjeta de host; hostnavigator - Navegador de hosts; itemcard - Tarjeta de item; itemhistory - Historial de item; itemnavigator - Navegador de items; item - Valor de item; map - Mapa; navtree - Árbol de navegación de mapas; piechart - Gráfico circular; problemhosts - Hosts con problemas; problems - Problemas; problemsbysv - Problemas por severidad; scatterplot - Gráfico de dispersión; slareport - Informe de SLA; svggraph - Gráfico; systeminfo - Información del sistema; tophosts - Hosts principales; topitems - Items principales; toptriggers - Triggers principales; trigover - Resumen de triggers; url - URL; web - Monitorización web. |
| x | integer | Posición horizontal desde el lado izquierdo del dashboard. Valores posibles:1 0-71. |
| y | integer | Posición vertical desde la parte superior del dashboard. Valores posibles:1 0-63. |
| name | string | Nombre personalizado del widget. |
| width | integer | Ancho del widget. Valores posibles:1 1-72. |
| height | integer | Altura del widget. Valores posibles:1 1-64. |
| hide_header | string | Ocultar el encabezado del widget. Valores posibles:1 NO (0, predeterminado), YES (1). |
| fields | Elemento raíz para los campos del widget del dashboard. |
Véase también: Dashboard widget (consulte la propiedad correspondiente con el mismo nombre).
Campo de widget del dashboard
| Elemento | Tipo | Descripción | |
|---|---|---|---|
| type | string | (obligatorio) Tipo de campo del widget. Valores posibles:1 INTEGER (0), STRING (1), HOST_GROUP (2), HOST (3), ITEM (4), ITEM_PROTOTYPE (5), GRAPH (6), GRAPH_PROTOTYPE (7), MAP (8), SERVICE (9), SLA (10), USER (11), ACTION (12), MEDIA_TYPE (13). |
|
| name | string | (obligatorio) Nombre del campo del widget. | |
| value | mixed | (obligatorio) Valor del campo del widget, según el tipo de campo. | |
| host | string | host del item. | |
| key | string | Clave del item. | |
Véase también: Campo de widget del dashboard (consulte la propiedad correspondiente con un nombre coincidente).
Notas al pie
1 Los valores enteros de la API entre paréntesis, por ejemplo, ENABLED (0), se mencionan solo como referencia. Para más información, consulte la página del objeto de la API enlazada en la entrada de la tabla o al final de cada sección.