
- Monitor application performance using OpenTelemetry
- Introduction
- What you will build
- Prerequisites
- Step 1: Set up ClickHouse
- Step 2: Configure telemetry data source in Zabbix
- Step 3: Set up Zabbix proxy with APM
- Step 4: Send telemetry data to Zabbix proxy
- Step 5: Explore traces
- Step 6: Explore logs
- Step 7: Create items and triggers from telemetry data
- Step 8: Monitor the APM collector
- Next steps
- Troubleshooting
Monitor application performance using OpenTelemetry
Introduction
This guide sets up application performance monitoring (APM) in Zabbix. The OpenTelemetry demo (an online store made of different services, with simulated users) is used as the monitored application.
The guide is designed for users who already know the basics of Zabbix (e.g., how to create hosts, items, and triggers), but are new to APM. If you are new to Zabbix, start with Basic configuration. By the end of the guide, the OpenTelemetry demo will send telemetry data to Zabbix, and you will be able to:
- Trace requests through the services of the store (e.g., find out that a checkout was slow because of the shipping service).
- See metrics and log records (e.g., CPU usage of the machine, or log records of failed payments).
- Turn the raw telemetry data into Zabbix items and triggers (e.g., Checkout: Slow responses).
What you will build
Zabbix APM is based on OpenTelemetry, an open standard for collecting telemetry data (traces, metrics, logs) from applications. This means that Zabbix can collect telemetry data from any application or tool that supports OpenTelemetry.
To collect, store, and display the telemetry data of the OpenTelemetry demo, you will add three new components to your Zabbix setup:
-
OpenTelemetry demo - an online store whose services are already instrumented with OpenTelemetry: they record what they do while handling each request, and send these records as telemetry data to the included OpenTelemetry Collector, a program that receives, processes, and forwards telemetry data, and can also collect some telemetry data by itself (e.g., measure CPU usage).
-
Zabbix proxy with APM - receives telemetry data from the OpenTelemetry Collector and writes it to ClickHouse. Only Zabbix proxy can receive telemetry data (Zabbix server cannot), so even a single-machine setup needs a proxy.
-
ClickHouse - the telemetry data source, that is, the database that stores the telemetry data.
To keep things simple, all of the components are installed on the same machine as Zabbix server and Zabbix frontend:
    OpenTelemetry demo services
(frontend, checkout, payment, etc.)
                 │
                 │ traces, metrics, logs (OTLP/HTTP or OTLP/gRPC, depending on the service)
                 ▼
      OpenTelemetry Collector ◄── metrics ── Host CPU, memory, disk; Docker containers
                 │
                 │ traces, metrics, logs (OTLP/gRPC)
                 ▼
           Zabbix proxy
                 │
                 │
                 ▼
            ClickHouse ◄── queries ── Zabbix server, Zabbix frontend
Applications that send OTLP/gRPC (e.g., applications that use OpenTelemetry for Java, .NET, or Python) can send telemetry data directly to Zabbix proxy, without the OpenTelemetry Collector. This guide uses the OpenTelemetry Collector because most services of the OpenTelemetry demo send OTLP/HTTP, which Zabbix proxy does not accept, and because the Collector also collects host and container metrics.
Prerequisites
- One machine for all components (Zabbix server, Zabbix frontend, Zabbix proxy, ClickHouse, OpenTelemetry demo).
- 16 GB of RAM, 8 CPU cores, and 20 GB of free disk space (with fewer resources, the OpenTelemetry demo may need adjustments).
- A user that can run commands with
sudo. - Zabbix 8.0 from packages. This guide uses 8.0 + Ubuntu 24.04 + Server, Frontend, Agent 2 + MySQL + Apache. If you have a different environment, some steps in this guide may differ.
If you install the components on different machines, replace 127.0.0.1 in the configuration examples with the addresses of the corresponding machines, and allow the following connections in the firewall.
Note that ClickHouse accepts only local connections by default (see the listen_host setting in ClickHouse documentation).
| Port | Listened on by | Connections from |
|---|---|---|
| 4317 | Zabbix proxy APM collector (OTLP/gRPC) | OpenTelemetry Collector of the OpenTelemetry demo |
| 8080 | OpenTelemetry demo (web store and feature flags) | Web browser |
| 8123 | ClickHouse (HTTP) | Zabbix proxy, Zabbix server, Zabbix frontend |
| 10051 | Zabbix server | Zabbix proxy |
Step 1: Set up ClickHouse
In this step, you will install ClickHouse and create the database and tables that store telemetry data. Zabbix proxy writes telemetry data to these tables but does not create them, so you will create them with the scripts provided by Zabbix. Before you start, check the requirements for ClickHouse as a telemetry data source.
1. Install and start ClickHouse as described in the ClickHouse documentation.
During the installation, you will be asked to set a password for the default user (the ClickHouse administrator); this guide refers to it as <clickhouse_default_password>.
2. After the installation, check that ClickHouse is running and that its version meets the requirements:
clickhouse-client \
  --user default \
  --ask-password \
  --query "SELECT version()"

# 26.9.21.9
3. Create the otel database:
clickhouse-client \
  --user default \
  --ask-password \
  --query "CREATE DATABASE IF NOT EXISTS otel"
4. Create the tables using the otel_all.sh script (replace <clickhouse_default_password>):
/usr/share/zabbix/sql-scripts/clickhouse/otel_all.sh \
  -s http://127.0.0.1:8123 \
  -d otel \
  -u default \
  -p '<clickhouse_default_password>' \
  -t 604800
The -t option keeps telemetry data for 7 days (604800 seconds); without it, the data is kept for 31 days.
To keep the data for a different period, change the -t value (e.g., 2592000 for 30 days).
You can also change the data storage period of the otel_* tables later (see ALTER TABLE ... MODIFY TTL in ClickHouse documentation).
5. Check that the tables were created:
clickhouse-client \
  --user default \
  --ask-password \
  --query "SHOW TABLES FROM otel"

# otel_logs
# otel_metrics_exponential_histogram
# otel_metrics_gauge
# otel_metrics_histogram
# otel_metrics_sum
# otel_traces
6. Create a ClickHouse user for Zabbix and grant it the privileges to write and read telemetry data in the otel database (replace <clickhouse_zabbix_password> with a password for the new zabbix user):
clickhouse-client --user default --ask-password

localhost :) CREATE USER IF NOT EXISTS zabbix IDENTIFIED WITH sha256_password BY '<clickhouse_zabbix_password>';
localhost :) GRANT SELECT, INSERT ON otel.* TO zabbix;
localhost :) exit;
7. Check that the zabbix user can read the new tables:
clickhouse-client \
  --user zabbix \
  --ask-password \
  --query "SELECT count() FROM otel.otel_traces"

# 0
Step 2: Configure telemetry data source in Zabbix
In this step, you will tell Zabbix where the telemetry data is stored. Zabbix proxy writes telemetry data to this database, and Zabbix server and Zabbix frontend read it. Because all three use the same setting, it is called the global telemetry data source, and you configure it only once.
1. Go to Administration > Data source > APM, mark the Enable global data source checkbox, and fill in the following parameters:
| Parameter | Value |
|---|---|
| Database type | ClickHouse (cannot be changed) |
| URL | http://127.0.0.1:8123 |
| Authentication | Username and password |
| Username | zabbix |
| Password | <clickhouse_zabbix_password> (use your password) |
| Database | otel |
2. Click Test. You should see a success message that Zabbix frontend can connect to ClickHouse.
3. Click Update to save the telemetry data source.
Step 3: Set up Zabbix proxy with APM
In this step, you will set up Zabbix proxy to receive telemetry data and write it to ClickHouse.
1. Go to Administration > Proxies and create a proxy with the following parameters:
| Parameter | Value |
|---|---|
| Proxy name | apm-proxy |
| Proxy mode | Active |
| Proxy address | 127.0.0.1 |
| APM | |
| Data collection enabled | ✓ |
| Max messages per second | Custom: 100 |
| Add resource attributes | Key - deployment.environment.nameValue - testCategory - TracesKey - deployment.environment.nameValue - testCategory - MetricsKey - deployment.environment.nameValue - testCategory - Logs |
2. Create the directory for the proxy's database file and make the zabbix user its owner:
sudo mkdir -p /var/lib/zabbix
sudo chown zabbix:zabbix /var/lib/zabbix
3. Install Zabbix proxy from packages (this guide uses 8.0 + Ubuntu 24.04 + Proxy + SQLite3 for the proxy's own configuration and buffered data).
During installation, when editing the DBName parameter in the proxy configuration file, set the following parameters as well:
# Address of Zabbix server; the proxy connects to it to get its configuration.
Server=127.0.0.1

# Name of the proxy; must match the proxy name entered in the Zabbix web interface.
Hostname=apm-proxy

# Port that the proxy listens on; the default port (10051) is already used by Zabbix server on this machine.
ListenPort=10052

# Full path to the database file, required for SQLite3.
DBName=/var/lib/zabbix/zabbix_proxy.db

# Starts the APM collector, which receives telemetry data over OTLP/gRPC on the default port 4317.
StartAPMCollector=1

# IP address of this machine that the APM collector listens on; replace it with yours (to see it, run: hostname -I).
# Do not use 127.0.0.1 (Docker containers cannot connect to it) or a Docker address (e.g., 172.17.0.1).
APMListenIP=192.0.2.10
4. Open Administration > Proxies and check that the proxy's Last seen (age) shows a recent time.
Step 4: Send telemetry data to Zabbix proxy
In this step, you will install Docker, set up the OpenTelemetry demo, and send its telemetry data to Zabbix proxy.
1. Install Docker Engine as described in the Docker documentation.
2. Check that Docker Compose is installed and that its version is 2.0.0 or later:
sudo docker compose version
# Docker Compose version v5.7.0
3. Download the OpenTelemetry demo to your home directory:
cd ~
git clone https://github.com/open-telemetry/opentelemetry-demo.git
4. Open the demo's configuration file:
nano ~/opentelemetry-demo/src/otel-collector/otelcol-config-extras.yml5. Add the following lines to the file (replace 192.0.2.10 with the IP address that you set in the APMListenIP parameter in Step 3):
exporters:
  otlp_grpc/zabbix:
    # APM collector of Zabbix proxy:
    endpoint: 192.0.2.10:4317
    tls:
      # No TLS, because APM TLS is not configured in Zabbix proxy:
      insecure: true
    sending_queue:
      # Sends data in batches, so that Zabbix proxy receives fewer messages (see Max messages per second in Step 3):
      batch:

service:
  pipelines:
    traces:
      exporters: [span_metrics, otlp_grpc/zabbix]
    metrics:
      exporters: [otlp_grpc/zabbix]
    logs:
      exporters: [otlp_grpc/zabbix]
By default, the demo's OpenTelemetry Collector sends the telemetry data of the demo services to the demo's own observability tools (e.g., Jaeger, Grafana).
The Collector merges this file with its default configuration; the exporter lists in this file replace the default ones, so the data is sent only to Zabbix proxy.
The traces pipeline must keep span_metrics, which calculates metrics from traces (e.g., request rates and durations); without it, the Collector does not start.
For details, see Bring your own backend in OpenTelemetry documentation.
6. Start the OpenTelemetry demo (it may take several minutes):
cd ~/opentelemetry-demo
sudo docker compose --env-file .env --env-file .env.override -f compose.yaml up --detach
7. Open the web store at http://192.0.2.10:8080 (replace 192.0.2.10 with the IP address of your machine) to check that the OpenTelemetry demo is running.
You don't need to use the store yourself: the load generator of the demo simulates users all the time.
To see the metrics that the Collector collects (e.g., CPU usage of the machine), go to APM > Metrics in the Zabbix web interface.
If the web store shows no products, or the demo or your machine becomes slow, see Troubleshooting.
Step 5: Explore traces
In this step, you will simulate a slow request and use traces to see it.
1. Open the feature flag page of the OpenTelemetry demo (http://192.0.2.10:8080/feature) and set intlShippingSlowdown to 10sec.
The shipping service will delay orders shipped to addresses outside the US by 10 seconds; one of the users that the load generator simulates has an address in Canada.
2. In the Zabbix web interface, go to APM > Traces and select Last 5 minutes in the time period selector.
3. Find the slow request:
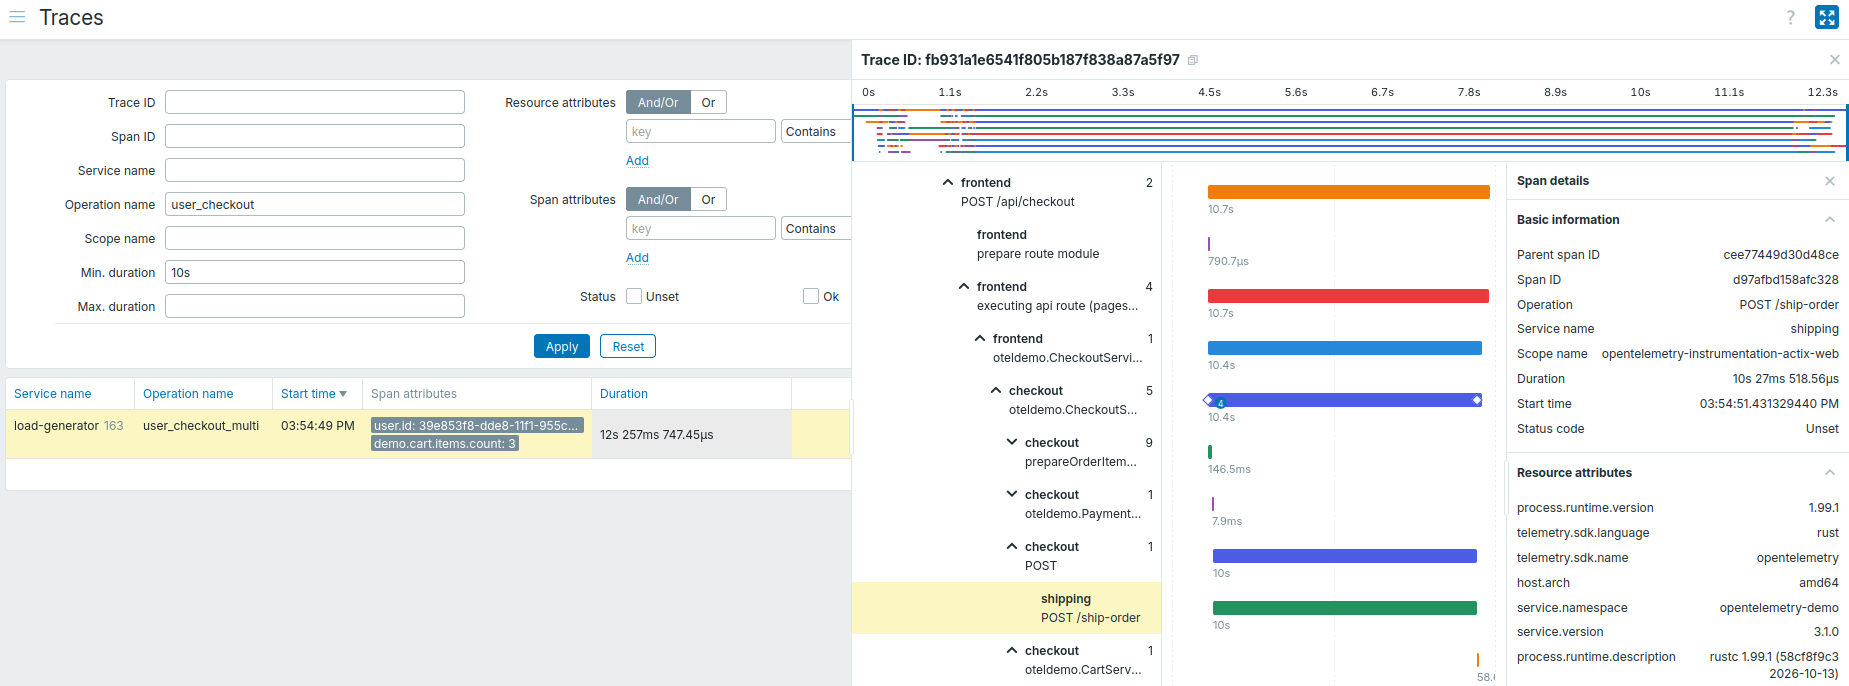
- In the filter, set Operation name to
user_checkout, Min. duration to10s, and click Apply. - Click a trace (if the list is empty, wait a few minutes, since only orders shipped outside the US are delayed).
- In the span tree, find the span of the
shippingservice that takes almost all the time.
4. Set the intlShippingSlowdown flag back to off.
Step 6: Explore logs
In this step, you will simulate failed payments and use logs to find out what happened.
1. Open the feature flag page of the OpenTelemetry demo (http://192.0.2.10:8080/feature) and set paymentFailure to 50%.
From now on, half of the requests to the payment service will fail.
2. In the Zabbix web interface, go to APM > Logs and select Last 5 minutes in the time period selector.
3. Find a failed payment:
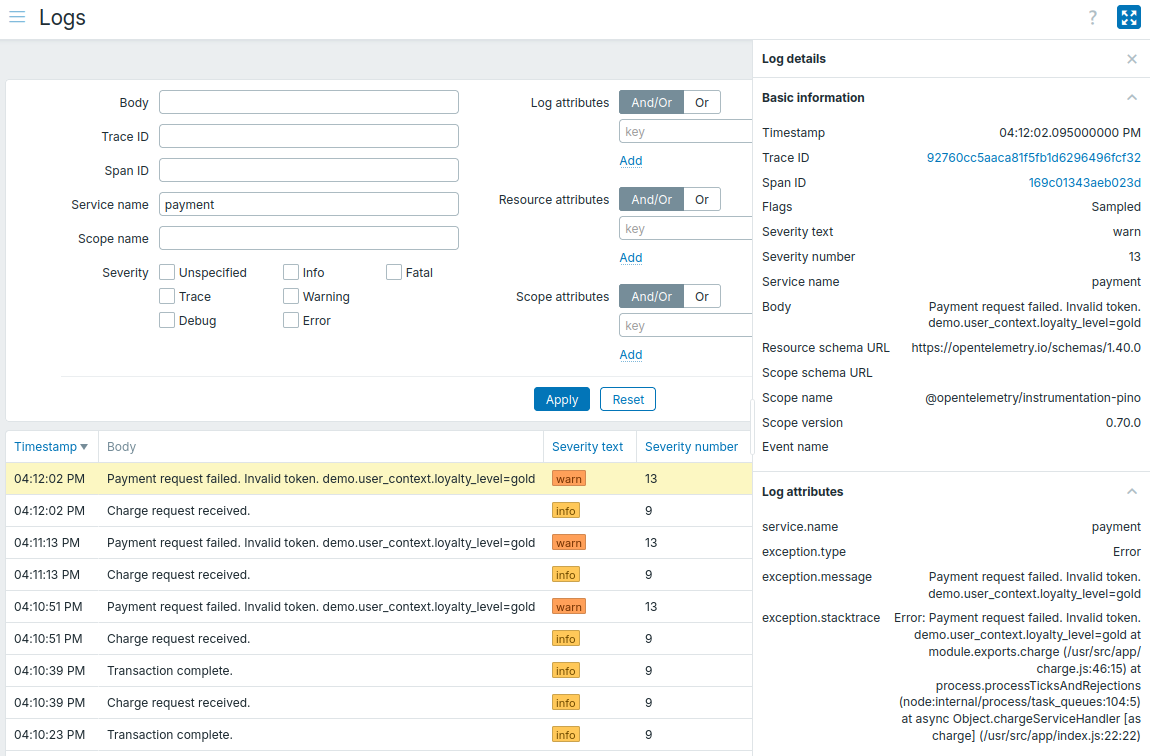
- In the filter, set Service name to
paymentand click Apply. - Click a log record of a failed payment to see its details (e.g., the trace ID, which links the log record to the trace of the failed request).
4. Set the paymentFailure flag back to off.
Step 7: Create items and triggers from telemetry data
In this step, you will create telemetry query items that calculate the checkout response time and the number of failed payments. You will also create triggers that alert you when checkouts are slow or payments fail.
Create items
1. Create a host with these parameters:
| Parameter | Value |
|---|---|
| Host name | OpenTelemetry demo |
| Host groups | Applications |
2. On the OpenTelemetry demo host, create two items:
Checkout: Response time, p95:
| Parameter | Value |
|---|---|
| Name | Checkout: Response time, p95 |
| Type | Telemetry query |
| Key | checkout.response_time.p95 |
| Type of information | Numeric (float) |
| Category | Traces |
| Aggregated columns | Function - percentilePercentage - 95Column - DurationAlias - p95 |
| Conditions | Type - ServiceNameOperator - equalsAttribute value - checkoutType - SpanKindOperator - equalsAttribute value - Server |
| Units | s |
| Update interval | 1m |
| Time shift | 30s |
| Lookback limit | 10m |
| Granularity | 1m |
| Description | The item calculates the duration that 95% of the requests to the checkout service did not exceed. For example, a "1s" value means that 95% of the requests took up to 1s, and 5% took longer. The query returns JSON with a value for each minute of the queried time range (usually one). For example: [{"clock":1794476853,"p95":245000000}]. Preprocessing takes the highest value with JSONPath, discards the value if there were no requests (empty JSON array), and uses a custom multiplier to convert it from nanoseconds to seconds. |
| Preprocessing | |
| JSONPath | $..p95.max()Custom on fail - Discard value |
| Custom multiplier | 1.0E-9 |
Payment: Failed requests:
| Parameter | Value |
|---|---|
| Name | Payment: Failed requests |
| Type | Telemetry query |
| Key | payment.failed_requests |
| Type of information | Numeric (unsigned) |
| Category | Traces |
| Aggregated columns | Function - countAlias - failed |
| Conditions | Type - ServiceNameOperator - equalsAttribute value - paymentType - SpanKindOperator - equalsAttribute value - ServerType - StatusCodeOperator - equalsAttribute value - Error |
| Update interval | 1m |
| Time shift | 30s |
| Lookback limit | 10m |
| Granularity | 1m |
| Description | The item counts the requests to the payment service that failed (spans with the "Error" status code). The query returns JSON with a value for each minute of the queried time range (usually one). For example: [{"clock":1794476853,"failed":12}]. Preprocessing adds up the values with JSONPath, and sets the value to 0 if no requests failed (empty JSON array). |
| Preprocessing | |
| JSONPath | $..failed.sum()Custom on fail - Set value to 0 |
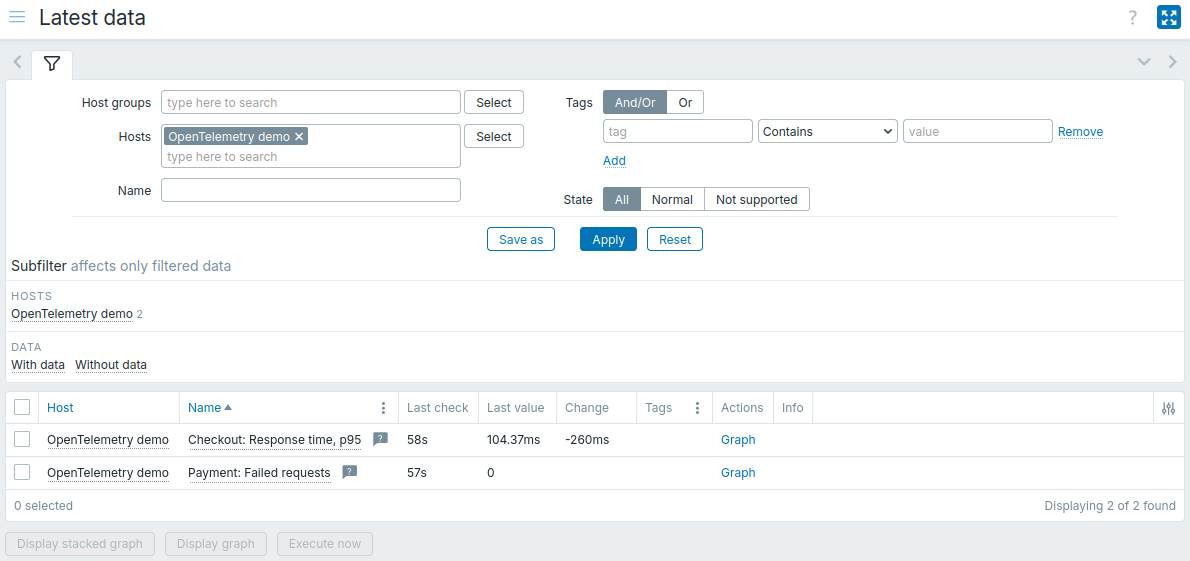
3. Go to Monitoring > Latest data and check that both items have values:
Create triggers
1. On the OpenTelemetry demo host, create two triggers:
Checkout: Slow responses (p95 > 2s):
| Parameter | Value |
|---|---|
| Name | Checkout: Slow responses (p95 > 2s) |
| Severity | Warning |
| Expression | max(/OpenTelemetry demo/checkout.response_time.p95,5m)>2and nodata(/OpenTelemetry demo/checkout.response_time.p95,5m)=0Notes: - The first line of the expression checks if checkouts were slow in the last 5 minutes. - The second line of the expression resolves the problem if no requests arrive for 5 minutes. Without it, the problem would stay open until the next request: Zabbix recalculates the trigger only when the item gets a new value, and the item gets no values while there are no requests (e.g., when the load generator is stopped). |
Payment: Failed requests:
| Parameter | Value |
|---|---|
| Name | Payment: Failed requests |
| Severity | Average |
| Expression | max(/OpenTelemetry demo/payment.failed_requests,5m)>0Notes: - The expression checks if payment requests failed in the last 5 minutes; the problem is resolved after 5 minutes without failed requests. |
2. Test the checkout trigger: on the feature flag page of the OpenTelemetry demo (http://192.0.2.10:8080/feature), set intlShippingSlowdown to 10sec.
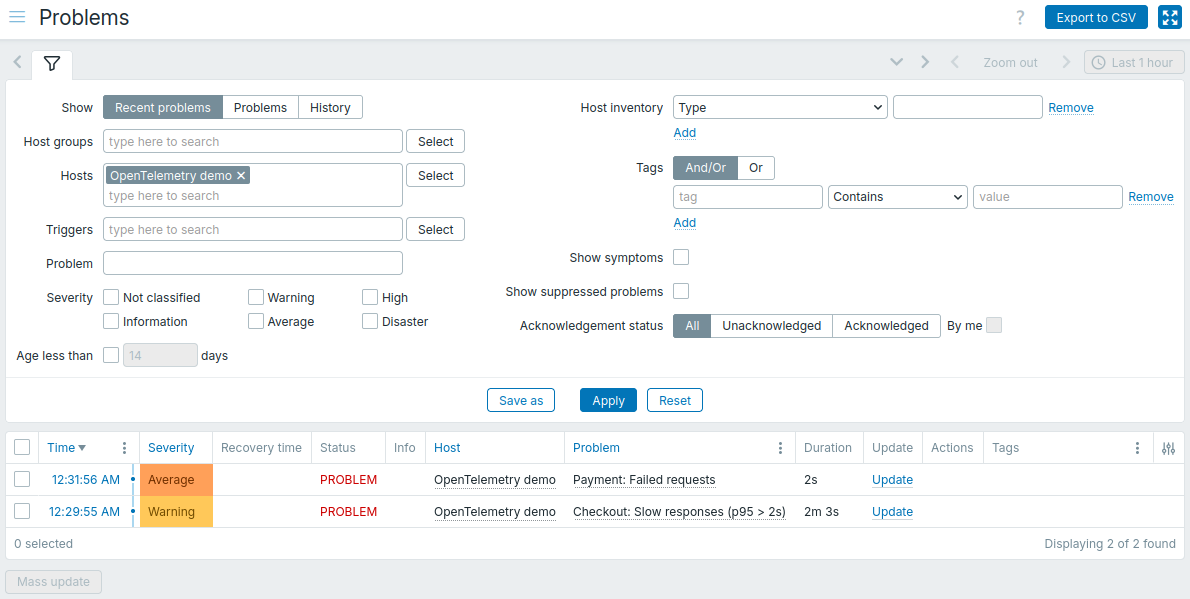
Then go to Monitoring > Problems and wait for the Checkout: Slow responses (p95 > 2s) problem; it appears after an order is shipped outside the US, usually within 10 minutes.
3. Test the payment trigger: set paymentFailure to 50%.
Turn on this flag only after the checkout problem appears, because failed payments stop orders before they are shipped.
Within a few minutes, the Payment: Failed requests problem appears as well:
4. Set both feature flags back to off.
Within a few minutes, both problems are resolved.
To receive notifications about such problems (e.g., by email), see Receive problem notifications.
Step 8: Monitor the APM collector
In this step, you will monitor whether the APM collector of Zabbix proxy drops telemetry data (e.g., because of the Max messages per second limit), and get a problem when it does.
1. Create a host with these parameters:
| Parameter | Value |
|---|---|
| Host name | apm-proxy |
| Host groups | Zabbix servers |
| Monitored by | Proxy (select apm-proxy) |
2. On the apm-proxy host, create an item with these parameters:
| Parameter | Value |
|---|---|
| Name | APM collector: Dropped requests per second |
| Type | Zabbix internal |
| Key | zabbix[apm,export] |
| Type of information | Numeric (float) |
| Description | The item returns the statistics of the APM collector as JSON. For example: {"rows":{...},"requests":{"accepted":13936,"dropped":0}} The numbers in the value are totals since Zabbix proxy started. Preprocessing takes the number of dropped requests and converts it into a rate (per second). |
| Preprocessing | |
| JSONPath | $.requests.dropped |
| Change per second | – |
3. Create a trigger with these parameters:
| Parameter | Value |
|---|---|
| Name | APM collector: Requests are dropped |
| Severity | Warning |
| Expression | last(/apm-proxy/zabbix[apm,export])>0Notes: - The expression checks if the APM collector dropped requests since the previous check of the item. |
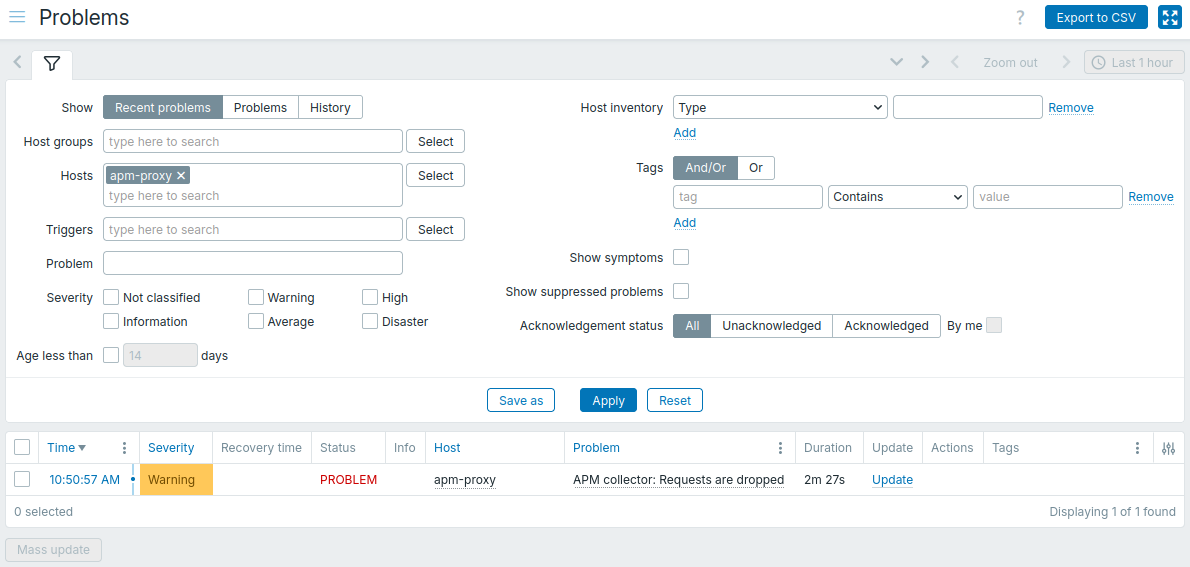
4. Test the trigger by setting Max messages per second to 1 in the apm-proxy configuration.
5. Go to Monitoring > Problems. Within a few minutes, a problem appears:
6. Set Max messages per second back to 100.
Within a minute, the problem is resolved.
Next steps
To monitor your own applications, instrument them with OpenTelemetry, which supports most programming languages. Many of them (e.g., Java, .NET, Python, Node.js) can be instrumented without changing the code (see OpenTelemetry documentation). Applications that can send OTLP/gRPC can send telemetry data directly to Zabbix proxy (port 4317); others can send it through the OpenTelemetry Collector, as in this guide.
To protect telemetry data in transit, configure TLS for the APM collector with the APMTLSCAFile, APMTLSCertFile, and APMTLSKeyFile proxy parameters.
To stop the OpenTelemetry demo when you no longer need it, run the following commands:
cd ~/opentelemetry-demo
sudo docker compose --env-file .env --env-file .env.override -f compose.yaml down --volumes
Troubleshooting
Some services of the OpenTelemetry demo have low memory limits. If a service reaches its limit, the system keeps rereading the service's files from disk, which overloads the CPU; the service may stop responding or slow down the services that depend on it. Also, the load generator simulates some users with a real web browser, which needs a lot of CPU.
1. Check whether any demo services are unhealthy or use almost all of their memory limit:
cd ~/opentelemetry-demo
sudo docker compose ps -a --format "table {{.Name}}\t{{.Status}}"
sudo docker stats --no-stream --format "table {{.Name}}\t{{.MemUsage}}"

# NAME              STATUS
# ...
# product-catalog   Up 6 minutes (unhealthy)
# ...
# NAME              MEM USAGE / LIMIT
# ...
# flagd             63.39MiB / 75MiB
# ...
2. If they do, raise the memory limits and turn off the simulated browser users in the file that the demo provides for your own additions:
nano ~/opentelemetry-demo/compose.extras.yaml3. Replace the contents of the file with these lines:
services:
  checkout:
    deploy:
      resources:
        limits:
          memory: 100M
    environment:
      - GOMEMLIMIT=80MiB
  product-catalog:
    deploy:
      resources:
        limits:
          memory: 100M
    environment:
      - GOMEMLIMIT=80MiB
  shipping:
    deploy:
      resources:
        limits:
          memory: 100M
  payment:
    deploy:
      resources:
        limits:
          memory: 250M
  flagd:
    deploy:
      resources:
        limits:
          memory: 150M
    environment:
      - GOMEMLIMIT=120MiB
  quote:
    deploy:
      resources:
        limits:
          memory: 100M
  email:
    deploy:
      resources:
        limits:
          memory: 200M
  load-generator:
    environment:
      - LOCUST_BROWSER_TRAFFIC_ENABLED=false
4. Apply the changes; only the changed services are restarted:
sudo docker compose --env-file .env --env-file .env.override -f compose.yaml -f compose.extras.yaml up --detach