
3 グラフ
概要
ホストのカスタムグラフ一覧には、データ収集 → ホスト から、対象のホストの グラフ をクリックしてアクセスできます。
既存のグラフ一覧が表示されます。
表示されるデータ:
| Column | Description |
|---|---|
| ホスト | グラフのホストです。 ホスト名をクリックすると、そのホストの設定フォームが開きます。 この列は、フィルターで複数のホストが選択されている場合、またはホストが選択されていない場合にのみ表示されます。 |
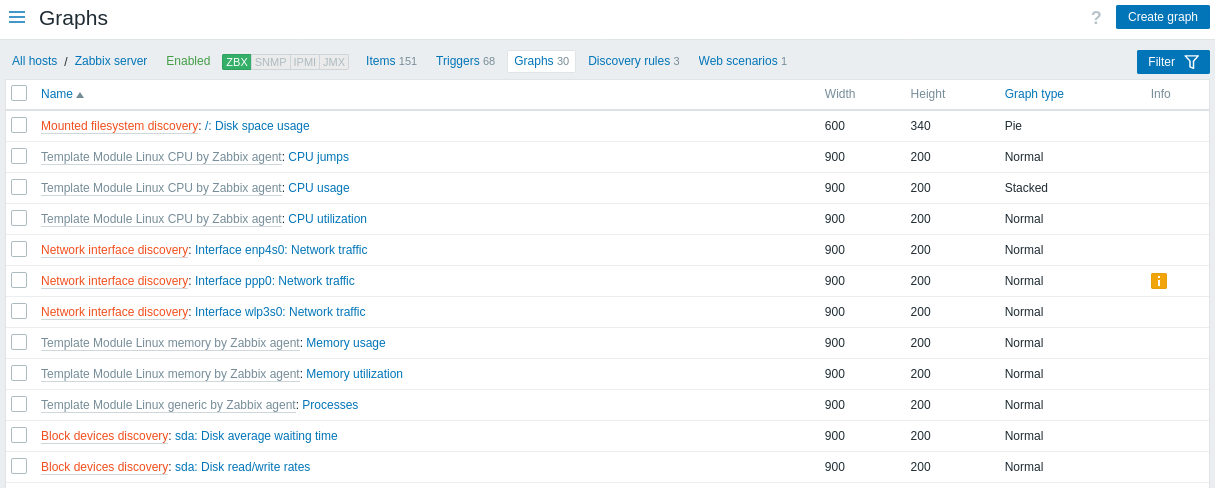
| Name | カスタムグラフの名前で、グラフ詳細への青いリンクとして表示されます。 グラフ名リンクをクリックすると、グラフの設定フォームが開きます。 ホストのグラフがテンプレートに属している場合、グラフ名の前にテンプレート名が灰色のリンクとして表示されます。テンプレートリンクをクリックすると、テンプレートレベルのグラフ一覧が開きます。 グラフがグラフプロトタイプから作成されている場合、その名前の前に低レベルディスカバリルール名がオレンジ色で表示されます。ディスカバリルール名をクリックすると、グラフプロトタイプ一覧が開きます。 |
| Width | グラフの幅が表示されます。 |
| Height | グラフの高さが表示されます。 |
| Graph type | グラフの種類が表示されます - Normal、Stacked、Pie、または Exploded。 |
| Info | グラフが正常に動作している場合、この列にはアイコンは表示されません。エラーがある場合は、"i" の文字が入った四角いアイコンが表示されます。アイコンにマウスオーバーすると、エラーの説明を含むツールチップが表示されます。 |
新しいグラフを設定するには、右上隅の Create graph ボタンをクリックします。
一括編集オプション
一覧の下にあるボタンでは、いくつかの一括編集オプションを利用できます。
- コピー - グラフを他のホストまたはテンプレートにコピーします
- 削除 - グラフを削除します
これらのオプションを使用するには、対象のグラフの前にあるチェックボックスを選択し、必要なボタンをクリックします。
フィルターの使用
グラフはホストグループとホストでフィルタリングできます。検索パフォーマンスを向上させるために、データはマクロを解決せずに検索されます。