
Logs
Overview
The APM > Logs section displays log records collected from your applications and services.
A log record is a text record of an event (e.g., a failed payment or a database timeout). Each log record has a severity and a message (body). If a log record was produced during an operation that is part of a trace, it also contains the IDs of that trace and span.
Each log record is produced by a service (e.g., zabbix-frontend; named by the OpenTelemetry service.name resource attribute), and by an instrumentation scope, the part of the code that created it (e.g., a logging library).
To provide context about each event, log records also have key-value attributes: log attributes describe the event itself (e.g., log.file.path: /var/log/zabbix/zabbix_frontend.log), and resource attributes describe the service and the environment it runs in (e.g., host.name: eabf8c2a5ddc).
For more details on logs, see the OpenTelemetry documentation.
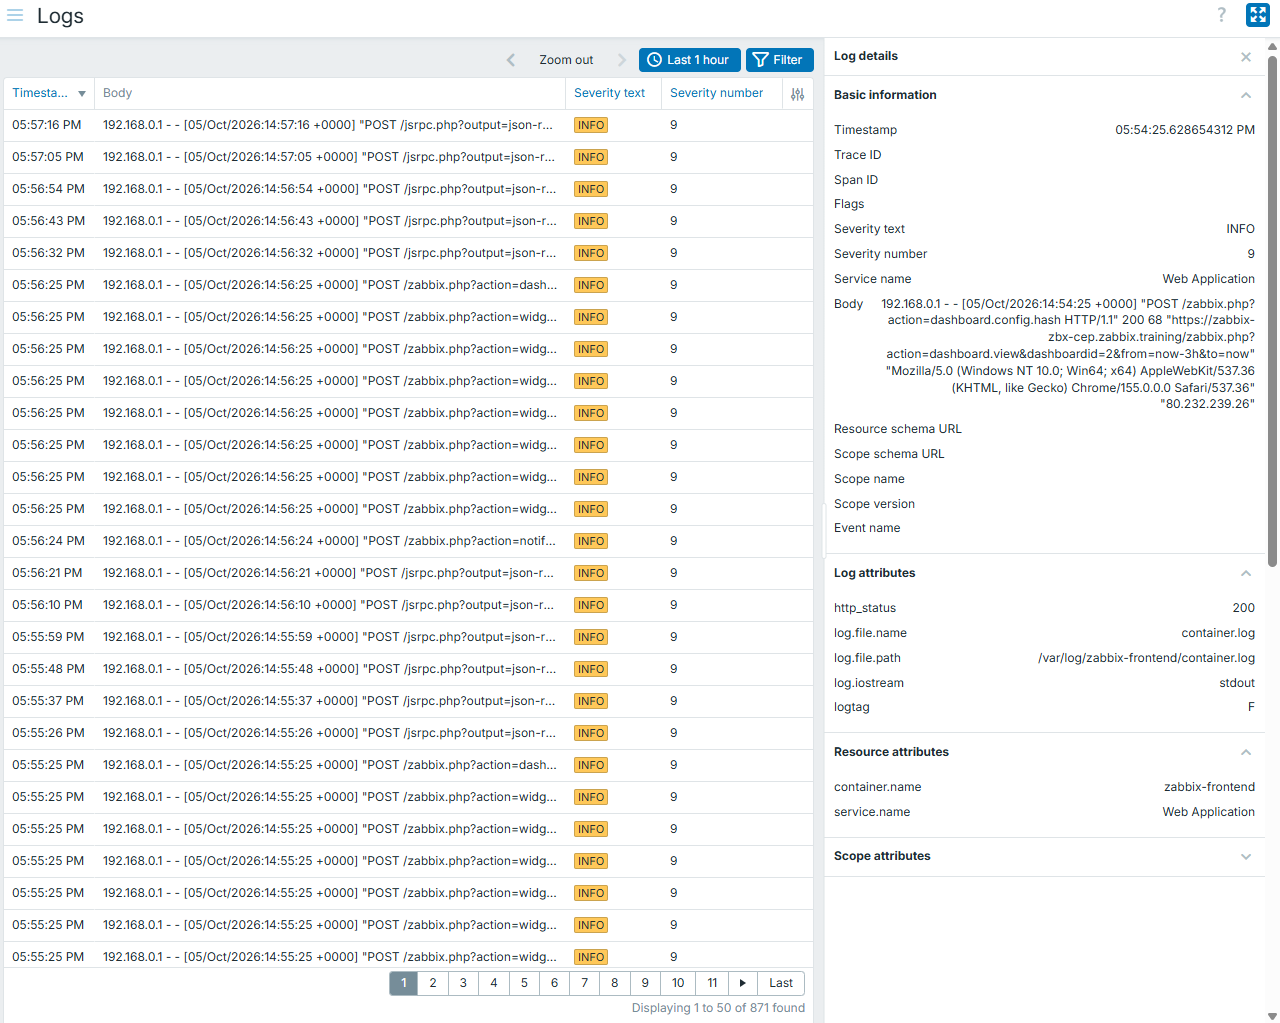
The APM > Logs section contains the following elements:
- Kiosk mode button - display only the page content, without the menu and header.
- Time period selector - select the time period for which to display log records.
- Filter - display only the log records you are interested in.
- Log list - view the log records.
- Log details - view the details of the selected log record.
Log list
Each row in the log list represents a log record.
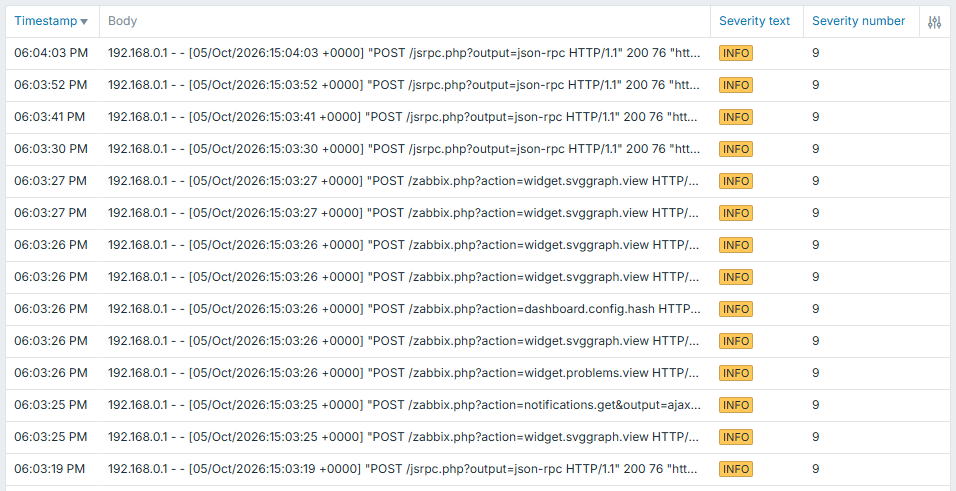
Log records are displayed in a customizable table.
The  Customize table button in the table header lets you show, hide, or reorder columns, and reset the layout to default.
You can also resize each column by dragging its right border; double-click the border to reset.
All customizations are applied immediately and remembered for the current user.
Customize table button in the table header lets you show, hide, or reorder columns, and reset the layout to default.
You can also resize each column by dragging its right border; double-click the border to reset.
All customizations are applied immediately and remembered for the current user.
The log list can have the following columns:
Each column corresponds to a column in the otel_logs table of the telemetry data source; for the list of columns, see Supported telemetry data columns.
Most columns have the same name as in the data source (e.g., Severity text corresponds to the SeverityText column).
Where the names differ, the data source column is specified in the table below.
| Column | Description |
|---|---|
| Timestamp | Date and time when the event occurred. |
| Body | Message of the log record. |
| Severity text | Severity level as provided by the application (e.g., INFO, WARN, or ERROR).The label color depends on the severity. |
| Severity number | Severity level as a number: 0 - UNSPECIFIED. 1-4 - TRACE. 5-8 - DEBUG. 9-12 - INFO. 13-16 - WARN. 17-20 - ERROR. 21-24 - FATAL. |
| Trace ID | ID, if any, of the trace during which the log record was produced. |
| Span ID | ID, if any, of the span during which the log record was produced. |
| Flags | Trace flags of the log record: 0 - the trace is not sampled. 1 - the trace is sampled (recorded). Data source column: TraceFlags. |
| Service name | Service that produced the log record. |
| Scope name | Instrumentation scope that produced the log record. |
| Scope version | Version of the instrumentation scope. |
| Event name | Name, if any, of the event type that the log record represents. |
| Log attributes | Log attributes of the log record. Click the  three-dot button to display all attributes. three-dot button to display all attributes. |
| Resource attributes | Resource attributes of the log record. Click the three-dot button to display all attributes. |
| Scope attributes | Attributes of the instrumentation scope. Click the three-dot button to display all attributes. |
Log details
Click a log record in the log list to open the Log details panel, which shows all information about the log record.
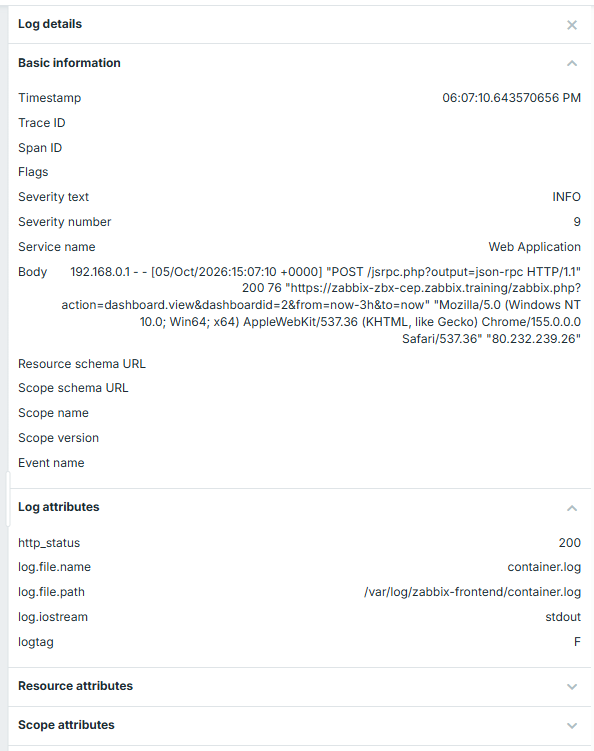
The Log details panel can have the following sections:
| Section | Description |
|---|---|
| Basic information | Trace ID, span ID, and trace flags of the log record. |
| Log attributes | Log attributes of the log record. |
| Resource attributes | Schema URL and resource attributes. |
| Scope attributes | Schema URL, name, version, and attributes of the instrumentation scope. |
Using filter
You can use the filter to display only the log records you are interested in.
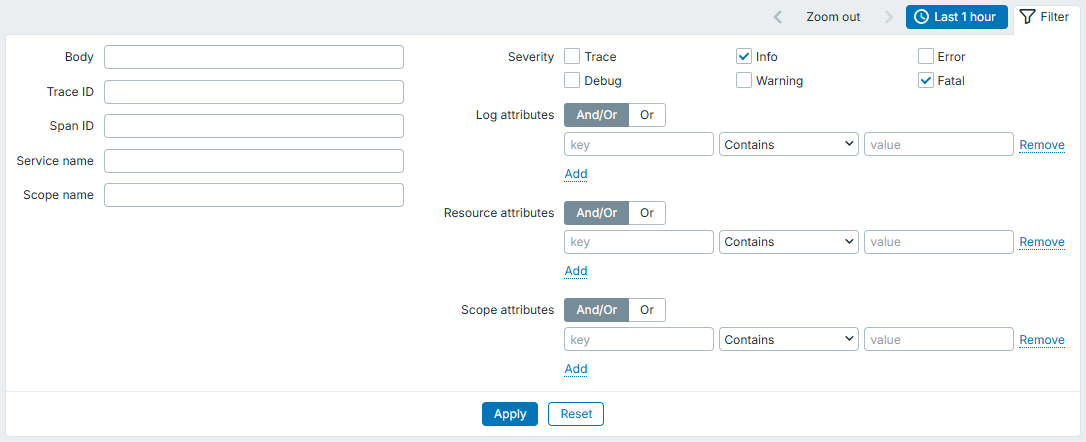
To filter by attributes, enter the attribute key, select the operator, and enter the attribute value.
The following operators are supported:
- Contains - (default) the attribute value contains the entered string.
- Equals - the attribute value equals the entered string.
- Does not contain - the attribute value does not contain the entered string.
- Does not equal - the attribute value does not equal the entered string.
- Exists - the attribute with the entered key exists.
- Does not exist - the attribute with the entered key does not exist.
If you add several conditions, select how to evaluate them:
- And/Or - (default) all conditions must be met; conditions with the same attribute key are combined with Or.
- Or - at least one condition must be met.