
2 ZabbixエージェントでWindowsを監視する
はじめに
このページでは、ZabbixでWindowsマシンの基本的な監視を開始するために必要な手順を説明します。
このガイドの対象者
このガイドは、Zabbixの新規ユーザー向けに作成されており、Windowsマシンの基本的な監視を有効にするために必要な最小限の手順が含まれています。高度なカスタマイズオプションやより高度な設定が必要な場合は、Zabbixマニュアルの設定セクションを参照してください。
前提条件
このインストールガイドを進める前に、OSの指示に従ってZabbixサーバーとZabbixフロントエンドをダウンロードしてインストールする必要があります。
Zabbix エージェントのインストール
Zabbix エージェントは、データを収集するためのプロセスです。監視したい Windows マシンにインストールする必要があります。Windows 向けの Zabbix エージェントのインストール手順に従ってください。
監視のためのZabbixの設定
Zabbixエージェントは、アクティブモードまたはパッシブモード(同時に)でメトリクスを収集できます。
パッシブチェックは単純なデータリクエストです。Zabbixサーバーまたはプロキシがデータ(例:CPU負荷)を要求し、Zabbixエージェントがその結果をサーバーに返します。アクティブチェックはより複雑な処理が必要です。エージェントは最初にサーバーから独立して処理するアイテムのリストを取得し、その後データをまとめてサーバーに送信します。詳細はパッシブおよびアクティブエージェントチェックを参照してください。
Zabbixが提供する監視テンプレートは通常、Zabbixエージェント用のテンプレートとZabbixエージェント(アクティブ)用のテンプレートという2つの選択肢を提供します。最初のオプションでは、エージェントはパッシブモードでメトリクスを収集します。これらのテンプレートは、異なる通信プロトコルを使用しますが、同じ監視結果を提供します。
以降のZabbixの設定は、アクティブまたはパッシブのZabbixエージェントチェック用のテンプレートを選択するかによって異なります。
パッシブチェック
Zabbix frontend
1. Log into Zabbix frontend.
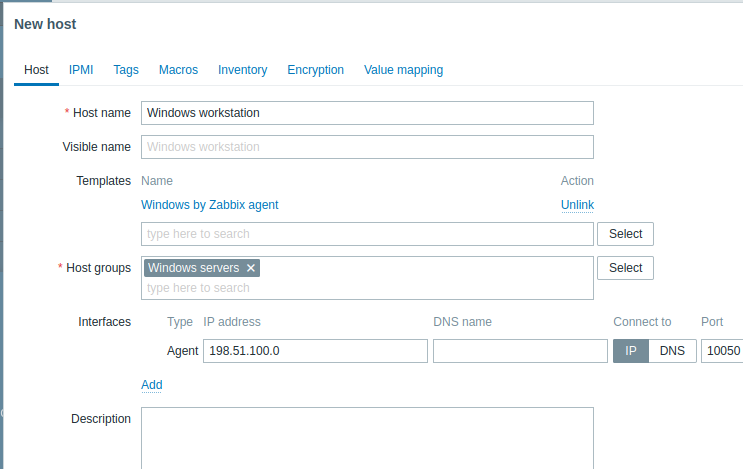
2. Create a host in Zabbix web interface.
This host will represent your Windows machine.
3. In the Interfaces parameter, add Agent interface and specify the IP address or DNS name of the Windows machine where the agent is installed.
4. In the Templates parameter, type or select Windows by Zabbix agent.
Zabbix agent
For passive checks Zabbix agent needs to know the IP address or DNS name of Zabbix server. If you
have provided correct information during the agent installation, the configuration file is already updated. Otherwise, you
need to manually specify it. Go to the C:\Program files\Zabbix Agent folder, open the file
zabbix_agentd.conf and add the IP/DNS of your Zabbix server to the Server parameter.
Example:
Server=192.0.2.22アクティブチェック
Zabbixフロントエンド
1. Zabbixフロントエンドにログインします。
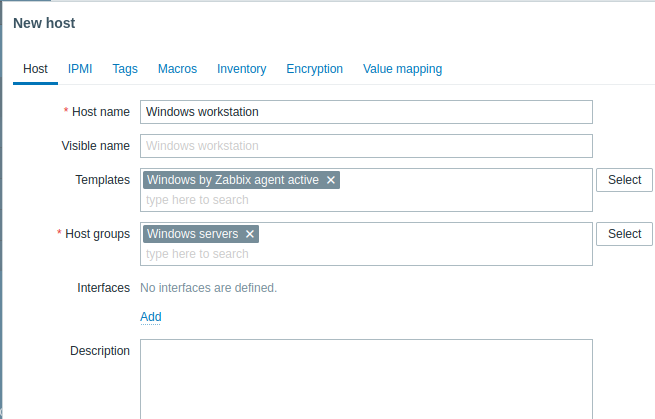
2. ZabbixのWebインターフェースでホストを作成します。
このホストは、Windowsマシンを表します。
3. テンプレートパラメータで、Windows by Zabbix agent activeを入力または選択します。
Zabbix agent
In the C:\Program files\Zabbix Agent folder open the file zabbix_agentd.conf and add:
- The name of the host you created in Zabbix web interface to the Hostname parameter.
- The IP address or DNS name of your Zabbix server machine to the ServerActive parameter (might be prefilled if you have provided it during Zabbix agent setup).
Example:
ServerActive= 192.0.2.22
Hostname=Windows workstation
収集されたメトリックを表示する
おめでとうございます。ここまでで、Zabbix はすでに Windows マシンを監視しています。
収集されたメトリックを表示するには、監視->ホスト
メニューセクション を開き、ホストの横にある 最新データ をクリックします。

障害アラートの設定
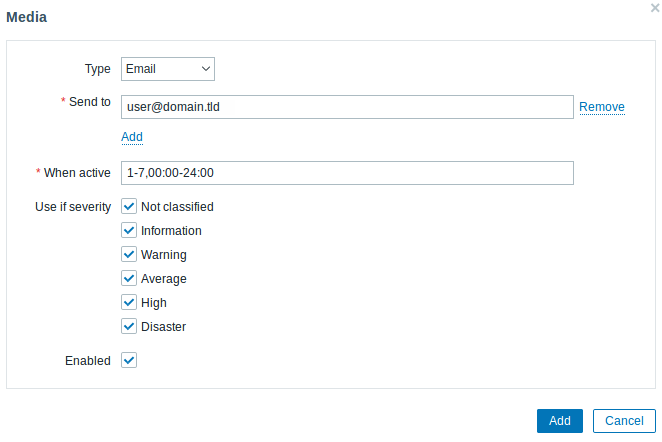
Zabbix は、さまざまな方法でインフラストラクチャの障害を通知できます。このガイドでは、メールアラートを送信するための設定手順を説明します。
1. User settings -> Profile に移動し、Media タブに切り替えて、メールアドレスを追加します。
2. 障害通知の受信 のガイドに従います。
次回 Zabbix が障害を検出したときに、メールでアラートを受け取れるはずです。
Windows では、CpuStres ユーティリティを使用して高い CPU 負荷をシミュレートし、その結果として障害アラートを受け取ることができます。
関連情報:
- アイテムの作成 - 追加のメトリクスの監視を開始する方法です(テンプレートを使わないカスタム監視)。
- Zabbix エージェントのアイテム, Windows 用 Zabbix エージェントのアイテム - Windows 上で Zabbix エージェントを使用して監視できるメトリクスの一覧です。
- 障害のエスカレーション - 複数段階のアラートシナリオを作成する方法です(例: まずシステム管理者にメッセージを送信し、45 分以内に障害が解決されない場合はデータセンター管理者にメッセージを送信する)。