
1 ZabbixエージェントでLinuxを監視する
はじめに
このページでは、Zabbix を使って Linux マシンの基本的な監視を開始するために必要な手順を順を追って説明します。 このチュートリアルで説明する手順は、あらゆる Linux ベースのオペレーティングシステムに適用できます。
このガイドの対象者
このガイドは、Zabbixを初めて使用するユーザー向けに設計されており、Linuxマシンの基本的な監視を有効にするために必要な最小限の手順が記載されています。詳細なカスタマイズオプションや、より高度な設定が必要な場合は、Zabbixマニュアルの設定セクションを参照してください。
前提条件
このガイドを進める前に、お使いのOSの手順に従って、ZabbixサーバーとZabbixフロントエンドをダウンロードしてインストールする必要があります。
Zabbix エージェントのインストール
Zabbix エージェントは、データ収集を担当するプロセスです。
Zabbix サーバーのバージョンを確認してください。
zabbix_server -V監視対象の Linux マシンに、同じバージョン(推奨)の Zabbix エージェントをインストールしてください。
監視のニーズに応じて、Zabbix サーバーがインストールされているマシンと同じマシンにインストールすることも、全く別のマシンにインストールすることもできます。
最適なインストール方法を選択してください。
-
Docker コンテナとして実行 - Zabbix Docker リポジトリ で利用可能なイメージのリストを参照してください。
-
Zabbix パッケージ からインストールする (Alma Linux、CentOS、Debian、Oracle Linux、Raspberry Pi OS、RHEL、Rocky Linux、SUSE Linux Enterprise Server、Ubuntu で利用可能)。
-
ソースからをコンパイルします。
Zabbix を監視用に設定する
Zabbix エージェントは、アクティブモードまたはパッシブモード(同時)でメトリックを収集できます。
パッシブチェックは単純なデータ要求です。Zabbix サーバーまたはプロキシがデータ(CPU 負荷など)を要求し、Zabbix エージェントがその結果をサーバーに返します。アクティブチェックはより複雑な処理を必要とします。エージェントはまず、サーバーから独立して処理するアイテムのリストを取得し、その後、データを一括して返送する必要があります。 詳細については、パッシブエージェントチェックとアクティブエージェントチェック を参照してください。
Zabbix が提供する監視テンプレートには、通常、Zabbix エージェント用テンプレートと、Zabbix エージェント(アクティブ)用テンプレートの 2 つの選択肢があります。最初のオプションでは、エージェントはパッシブモードでメトリックを収集します。 これらのテンプレートは、異なる通信プロトコルを使用しますが、同一の監視結果を提供します。
Zabbix のさらなる設定は、アクティブ または パッシブ Zabbix エージェント チェックのテンプレートを選択するかどうかによって異なります。
パッシブチェック
Zabbix エージェント
1. エージェントがインストールされているマシンで、エージェント設定ファイルを開きます。
sudo vi /etc/zabbix/zabbix_agentd.conf
2. Server パラメータに、Zabbix サーバーの IP アドレスまたは DNS 名を追加します。
Server=192.0.2.22
3. Zabbix エージェントを再起動します。
systemctl restart zabbix-agent
Zabbix フロントエンド
1. Zabbix フロントエンドにログインします。
2. Zabbix Web インターフェースで ホストを作成します。
- ホスト名 フィールドに、ホスト名を入力します (例: "Linux server")
- テンプレート フィールドに、ホストに リンク するテンプレート"Linux by Zabbix agent"を入力または選択します。
- ホストグループ フィールドに、ホストグループを入力または選択します (例: "Linux servers")。
- インターフェース パラメータに、エージェント インターフェースを追加し、エージェントがインストールされている Linux マシンの IP アドレスまたは DNS 名を指定します。
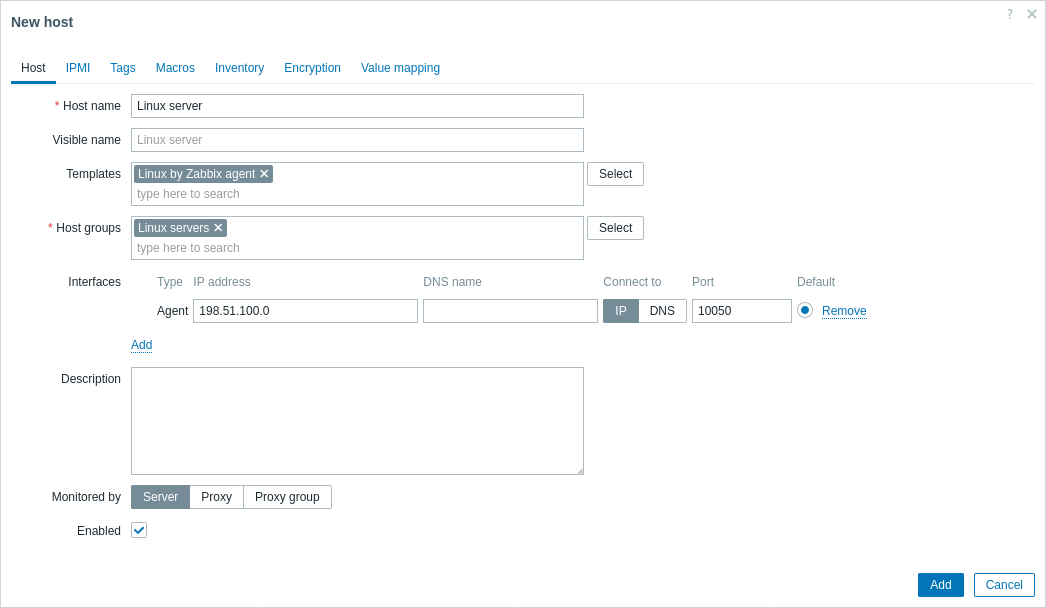
3. 追加 をクリックしてホストを追加します。このホストが監視対象のLinuxマシンになります。
アクティブチェック
Zabbix エージェント
1. エージェントがインストールされているマシンで、エージェント設定ファイルを開きます。
sudo vi /etc/zabbix/zabbix_agentd.conf2. ServerActive パラメータに、Zabbix サーバーの IP アドレスまたは DNS 名(およびオプションでポート番号)を追加します。例:
ServerActive=192.0.2.0:10051Zabbix エージェントはこのアドレスを使用して、Zabbix サーバーのトラッパーポート(デフォルト: 10051)に接続し、アクティブチェックの設定データを要求します。
3. Hostname パラメータを定義します。この値は、Zabbix フロントエンド で定義するホスト名と一致する必要があります。この例では、次のようになります。
Hostname=Linux serverHostname の値は一致する必要があります。これは、アクティブチェックにおいて、Zabbix エージェントがサーバーから正しいホスト設定を取得するために使用するためです。具体的には、エージェントはサーバーへの接続を開始し、ホスト名の値を使用して自身を識別します。サーバーは、そのホストの監視設定を提供します。これらの値が異なる場合、エージェントは適切な設定を受信できず、メトリックの欠落や監視の問題が発生します。
4. Zabbixエージェントを再起動します。
systemctl restart zabbix-agentZabbix フロントエンド
1. Zabbix フロントエンドにログインします。
2. Zabbix Web インターフェースで ホストを作成します。
- ホスト名 フィールドに、エージェント設定ファイルで定義した Hostname パラメータ値と一致するホスト名(例:"Linux server")を入力します。
- テンプレート フィールドに、ホストに リンク するテンプレート"Linux by Zabbix agent active"を入力または選択します。
- ホストグループ フィールドに、ホストグループ(例:"Linux servers")を入力または選択します。
- インターフェース は未定義のままにします。エージェントはサーバーからの接続を待機するのではなく、サーバーへの接続を開始するため、アクティブチェックではインターフェースは不要です。
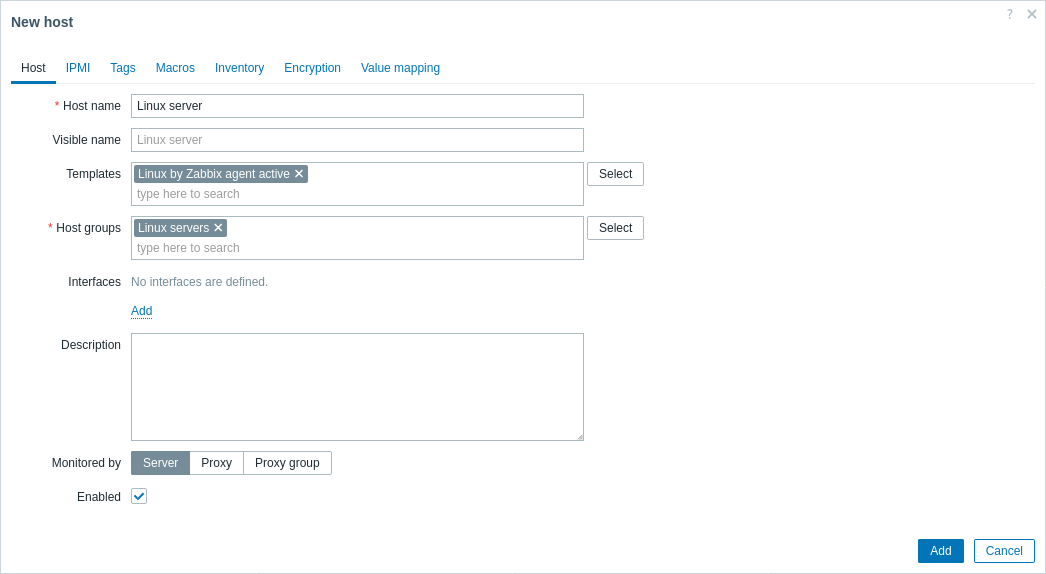
3. 追加をクリックしてホストを追加します。このホストが監視対象のLinuxマシンになります。
収集されたメトリックの表示
おめでとうございます!この時点で、Zabbix はすでに Linux マシンを監視しています。
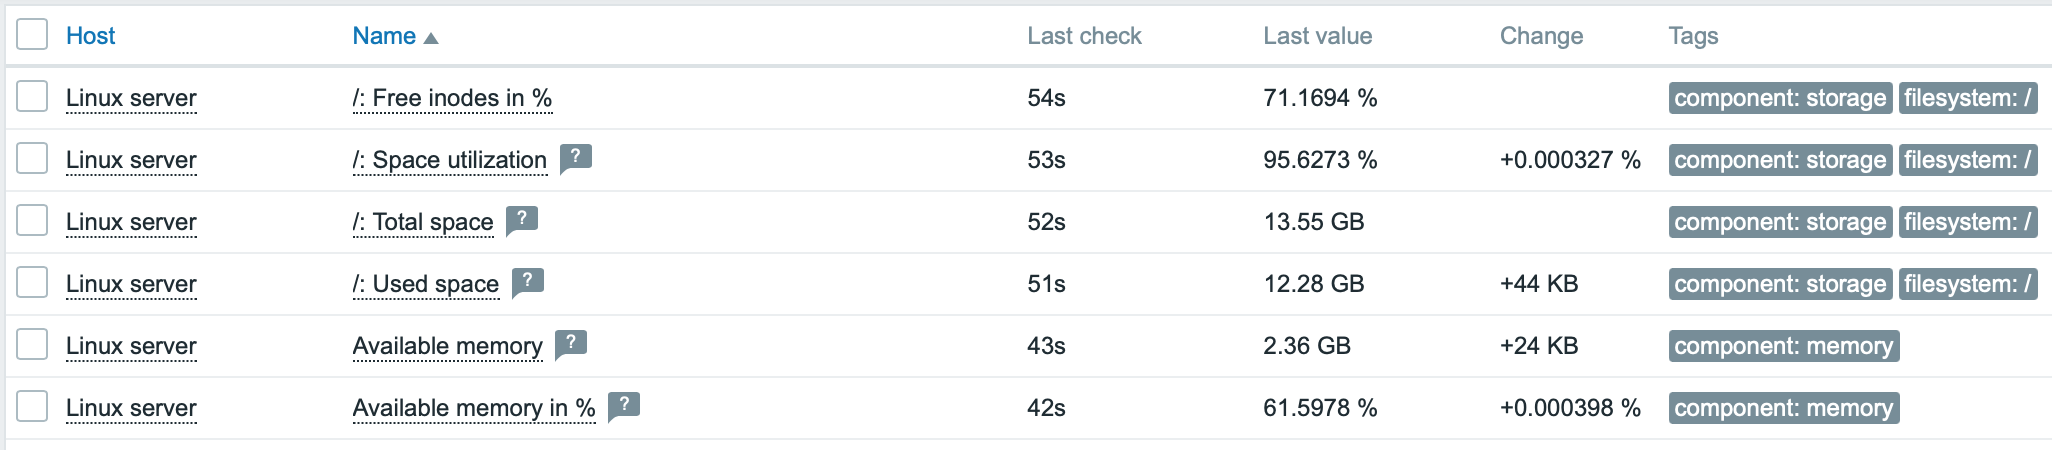
収集されたメトリックを表示するには、監視 -> ホスト メニューセクション を開き、ホストの横にある 最新データ をクリックします。

このアクションを実行すると、Linux サーバーホストから収集された最新のメトリックの一覧が表示されます。
問題アラートの設定
Zabbix は、インフラの問題を様々な方法で通知できます。
このガイドでは、メールアラートを送信するための設定手順を説明します。
1. ユーザー設定 -> プロファイル に移動し、メディア タブに切り替えて メールアドレスを追加 します。
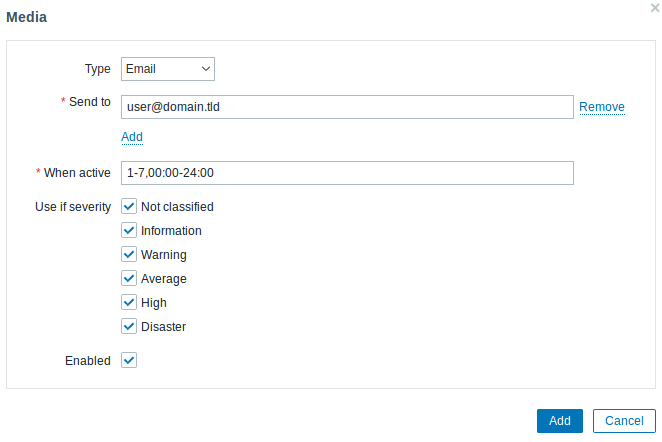
2. 問題通知の受信 のガイドに従います。
次回以降、Zabbix が問題を検出すると、メールでアラートが届くようになります。
設定をテストする
Linuxでは、次のコマンドを実行することでCPU負荷の高い状態をシミュレートし、結果として問題アラートを受け取ることができます。
cat /dev/urandom | md5sum
CPU負荷がしきい値を超えるには、複数のmd5sumプロセスを実行する必要がある場合があります。
Zabbixが問題を検出すると、監視->問題 セクションに表示されます。

アラートが設定済みの場合は、問題通知も受信します。
こちらも参照してください:
- アイテムの作成 - 追加メトリックの監視を開始する方法(テンプレートを使用しないカスタム監視)
- Zabbixエージェントアイテム、 Windows用Zabbixエージェントアイテム - WindowsでZabbixエージェントを使用して監視できるメトリックの完全なリスト
- 問題のエスカレーション - 複数段階のアラートシナリオを作成する方法 (例: 最初にシステム管理者にメッセージを送信し、45分以内に問題が解決されない場合はデータセンター管理者にメッセージを送信する)
- パッケージからのインストール - さまざまな Linux ディストリビューションの公式 RPM および DEB パッケージを使用して Zabbix コンポーネントをインストールし、最新の機能とバグ修正にアクセスする方法