
Zabbix統計のリモート監視
概要
Zabbixサーバーおよびプロキシの内部メトリクスの一部を、別のZabbixインスタンスまたはサードパーティ製ツールからリモートでアクセス可能にすることができます。
これは、サポート担当者やサービスプロバイダーがクライアントのZabbixサーバー/プロキシをリモートで監視する場合や、組織内でZabbixが主要な監視ツールではない場合に、Zabbixの内部メトリクスをサードパーティ製システムで包括的な監視構成の一部として監視する場合に役立ちます。
Zabbixの内部統計は、新しい 'StatsAllowedIP' server/proxy パラメータで指定された、設定可能なアドレスのセットに公開されます。要求は、これらのアドレスからのみ受け付けられます。
アイテム
別のZabbixインスタンスで内部統計のクエリを設定するには、次の2つの項目を使用します。
zabbix[stats,<ip>,<port>]internal item - Zabbixサーバー/プロキシの直接リモートクエリ用。 <ip>と<port>は、ターゲットインスタンスを識別するために使用しますzabbix.stats[<ip>,<port>]agent item - Zabbixサーバー/プロキシのエージェントベースのリモートクエリ用。 <ip>と<port>は、ターゲットインスタンスを識別するために使用されます。
参考情報: 内部項目, Zabbixエージェントアイテム
次の図はコンテキストに応じた、いずれかのアイテムの使用法を示しています。
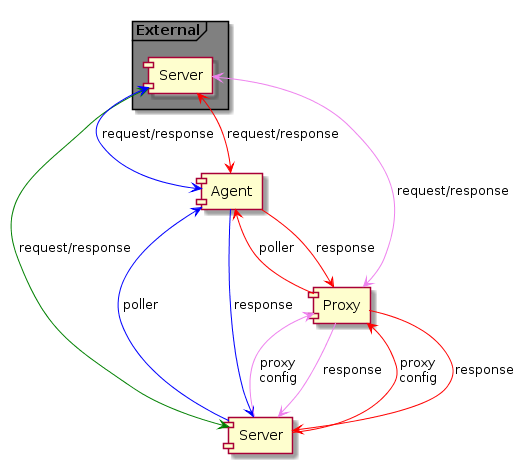
 - Server → external Zabbix instance (
zabbix[stats,<ip>,<port>]) - Server → proxy → external Zabbix instance (
zabbix[stats,<ip>,<port>]) - Server → agent → external Zabbix instance (
zabbix.stats[<ip>,<port>]) - Server → proxy → agent → external Zabbix instance (
zabbix.stats[<ip>,<port>])
ターゲットインスタンスが外部インスタンスによるクエリを許可するには、ターゲットインスタンスの'StatsAllowedIP'パラメータに外部インスタンスのアドレスをリストします。
収集されるメトリクス
statsアイテムは統計情報をまとめて収集し、JSON形式で返します。これは依存アイテムがデータを取得するための基礎となります。以下の内部メトリクスが、いずれかのアイテムによって返されます。
zabbix[boottime]zabbix[hosts]zabbix[items]zabbix[items_unsupported]zabbix[preprocessing](サーバーのみ)zabbix[preprocessing_queue](サーバーのみ)zabbix[process,<type>,<mode>,<state>](プロセスタイプベースの統計のみ)zabbix[rcache,<cache>,<mode>]zabbix[requiredperformance]zabbix[triggers](サーバーのみ)zabbix[uptime]zabbix[vcache,buffer,<mode>](サーバーのみ)zabbix[vcache,cache,<parameter>]zabbix[version]zabbix[vmware,buffer,<mode>]zabbix[wcache,<cache>,<mode>]('trends'キャッシュタイプはサーバーのみ)
テンプレート
テンプレートは、外部インスタンスからZabbixサーバーまたはプロキシの内部メトリクスをリモート監視するために利用できます:
- リモートZabbixサーバーヘルス
- リモートZabbixプロキシヘルス
複数の外部インスタンスのリモート監視用テンプレートを使用するには、各外部インスタンス監視ごとに個別のホストが必要であることに注意してください。
トラッパープロセス
外部のZabbixインスタンスからの内部メトリックリクエストの受信は、トラッパープロセスによって処理されます。このプロセスはリクエストを検証し、メトリックを収集し、JSONデータバッファを作成し、準備したJSONを返します。例えば、サーバーからは以下のようになります。
{
  "response": "success",
  "data": {
    "boottime": N,
    "uptime": N,
    "hosts": N,
    "items": N,
    "items_unsupported": N,
    "preprocessing": {
        "queued": {
          "count": N,
          "size": N
        },
        "direct": {
          "count": N,
          "size": N
        },
        "queue": N
    },
    "preprocessing_queue": N,
    "process": {
      "alert manager": {
        "busy": {
          "avg": N,
          "max": N,
          "min": N
        },
        "idle": {
          "avg": N,
          "max": N,
          "min": N
        },
        "count": N
      },
...
    },
    "queue": N,
    "rcache": {
      "total": N,
      "free": N,
      "pfree": N,
      "used": N,
      "pused": N
    },
    "requiredperformance": N,
    "triggers": N,
    "uptime": N,
    "vcache": {
      "buffer": {
        "total": N,
        "free": N,
        "pfree": N,
        "used": N,
        "pused": N
      },
      "cache": {
        "requests": N,
        "hits": N,
        "misses": N,
        "mode": N
      }
    },
    "vmware": {
      "total": N,
      "free": N,
      "pfree": N,
      "used": N,
      "pused": N
    },
    "version": "N",
    "wcache": {
      "values": {
        "all": N,
        "float": N,
        "uint": N,
        "str": N,
        "log": N,
        "text": N,
        "not supported": N
      },
      "history": {
        "pfree": N,
        "free": N,
        "total": N,
        "used": N,
        "pused": N
      },
      "index": {
        "pfree": N,
        "free": N,
        "total": N,
        "used": N,
        "pused": N
      },
      "trend": {
        "pfree": N,
        "free": N,
        "total": N,
        "used": N,
        "pused": N
      }
    }
  }
}
内部キューアイテム
別のZabbixインスタンスで内部キュー統計をリモートクエリできるようにする別の2つの項目もあります。
zabbix[stats,<ip>,<port>,queue,<from>,<to>]internal item - リモートZabbixサーバー/プロキシへの直接内部キュークエリ用zabbix.stats[<ip>,<port>,queue,<from>,<to>]agent item - リモートZabbixサーバー/プロキシへのエージェントベースの内部キュークエリ用
参考情報: 内部項目, Zabbixエージェントアイテム