
ウィジェットの作成 (チュートリアル)
これは、シンプルなダッシュボードウィジェットを作成する方法を示すステップバイステップのチュートリアルです。 このウィジェットのすべてのファイルをZIPアーカイブとしてダウンロードできます: lesson_gauge_chart.zip。
作成するもの
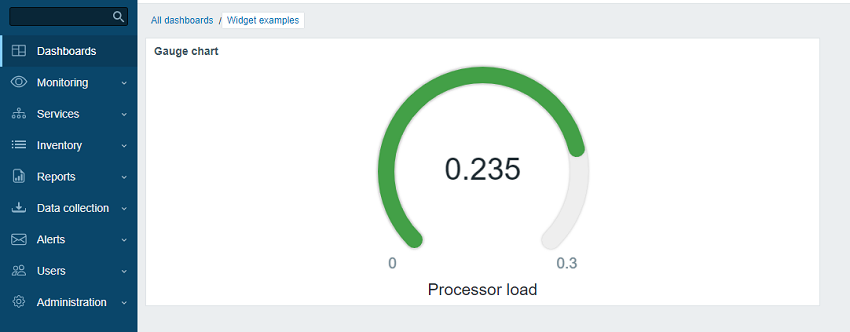
このチュートリアルでは、まず基本的な「Hello, world!」ウィジェットを作成し、その後、アイテムの値をゲージチャートとして表示するより高度なウィジェットに変換します。 完成したウィジェットは次のようになります。
パート I - "Hello, world!"
このセクションでは、最小限必要なウィジェット要素を作成し、新しいウィジェットをZabbixフロントエンドに追加する方法を学びます。
Zabbix Webインターフェースに空のウィジェットを追加する
- Zabbix Webインターフェースのインストール先にある
modulesディレクトリ内に、lesson_gauge_chartディレクトリを作成します(例: zabbix/ui/modules)。
すべてのカスタムウィジェットは外部モジュールとして扱われるため、Zabbix Webインターフェースのインストール先にある modules ディレクトリに追加する必要があります(例: zabbix/ui/modules)。
zabbix/ui/widgets ディレクトリは Zabbix 標準ウィジェット用に予約されており、Zabbix UI とともに更新されます。
- 基本的なウィジェットのメタデータを含む
manifest.jsonファイルを作成します(サポートされている parameters の説明を参照してください)。
ui/modules/lesson_gauge_chart/manifest.json
{
    "manifest_version": 2.0,
    "id": "lesson_gauge_chart",
    "type": "widget",
    "name": "Gauge chart",
    "namespace": "LessonGaugeChart",
    "version": "1.1",
    "author": "Zabbix"
}- Zabbix Webインターフェースで、Administration > General > Modules セクションに移動し、Scan directory ボタンをクリックします。
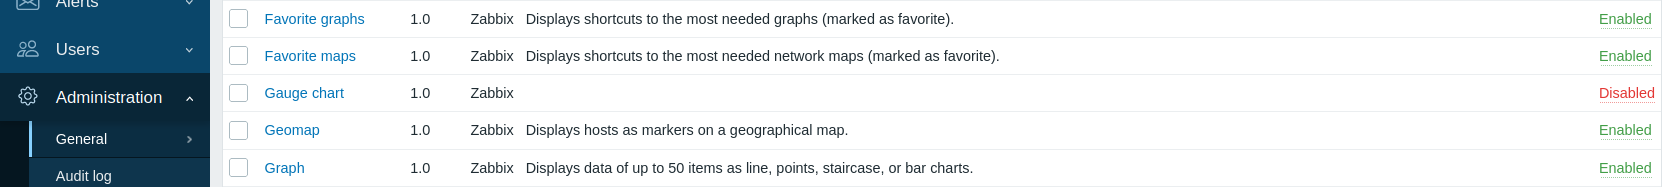
- 一覧から新しいモジュール Gauge chart を見つけ、"Disabled" のハイパーリンクをクリックして、モジュールの状態を "Disabled" から "Enabled" に変更します(モジュールが一覧に表示されない場合は、troubleshooting セクションを参照してください)。
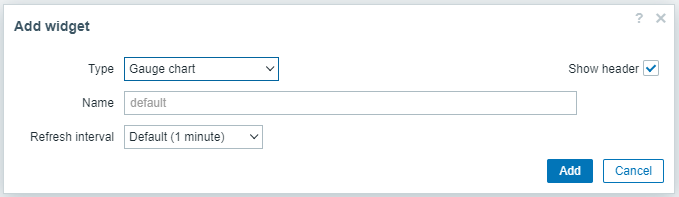
- ダッシュボードを開き、編集モードに切り替えて新しいウィジェットを追加します。 Type フィールドで "Gauge chart" を選択します。
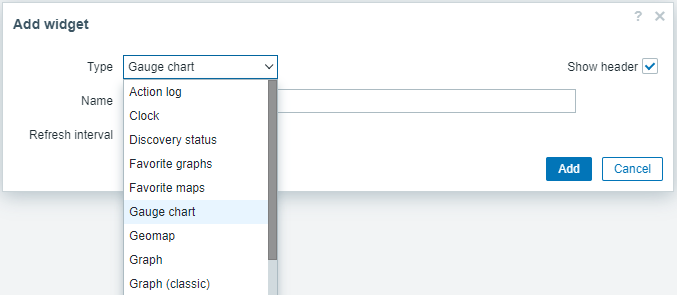
- この時点で、Gauge chart ウィジェットの設定には共通のウィジェット項目である Name と Refresh interval మాత్రమేが含まれています。 Add をクリックして、ウィジェットをダッシュボードに追加します。
- ダッシュボードに空のウィジェットが表示されるはずです。 右上隅の Save changes をクリックして、ダッシュボードを保存します。
![]()
ウィジェットビューを追加する
ウィジェットの view ファイルは views ディレクトリに配置する必要があります(このチュートリアルでは ui/modules/lesson_gauge_chart/views/)。
ファイル名が既定の widget.view.php の場合は、manifest.json ファイルに登録する必要はありません。
ファイル名が異なる場合は、manifest.json ファイルの actions/widget.lesson_gauge_chart.view セクションで指定してください。
-
lesson_gauge_chartディレクトリにviewsディレクトリを作成します。 -
viewsディレクトリにwidget.view.phpファイルを作成します。
ui/modules/lesson_gauge_chart/views/widget.view.php
<?php

/**
 * Gauge chart widget view.
 *
 * @var CView $this
 * @var array $data
 */

(new CWidgetView($data))
    ->addItem(
        new CTag('h1', true, 'Hello, world!')
    )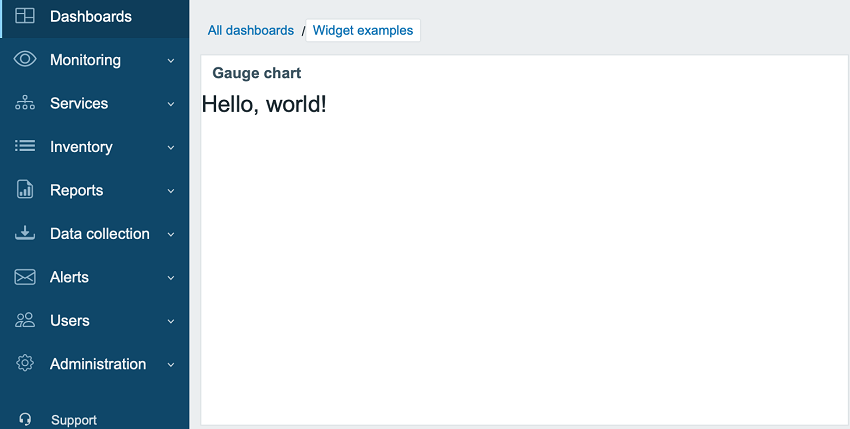
->show();- ダッシュボードを更新します。 これで Gauge chart ウィジェットに "Hello, world!" が表示されます。
パート II - ゲージチャート
設定ビューに設定を追加し、widget view で使用する
このセクションでは、widget の設定フィールドを追加し、その入力値を widget view でテキストとして表示する方法を学びます。
widget の設定は、フォーム (Zabbix\Widgets\CWidgetForm) と widget フォームビュー (widget.edit.php) で構成されます。
フィールド (Zabbix\Widgets\CWidgetField) を追加するには、Zabbix\Widgets\CWidgetForm を継承する WidgetForm クラスを作成する必要があります。
フォームには、ユーザーが入力した値を検証するために使用される、さまざまな種類のフィールド (Zabbix\Widgets\CWidgetField) が含まれます。
各入力要素タイプに対応するフォームフィールド (Zabbix\Widgets\CWidgetField) は、値をデータベースに保存するための単一の形式に変換します。
widget の form ファイルは includes ディレクトリに配置する必要があります(このチュートリアルでは ui/modules/lesson_gauge_chart/includes/)。
ファイル名がデフォルトの WidgetForm.php であれば、manifest.json ファイルに登録する必要はありません。
ファイル名が異なる場合は、manifest.json ファイルの widget/form_class セクションで指定してください。
-
lesson_gauge_chartディレクトリ内に新しいincludesディレクトリを作成します。 -
includesディレクトリ内にWidgetForm.phpファイルを作成します。
ui/modules/lesson_gauge_chart/includes/WidgetForm.php
<?php

namespace Modules\LessonGaugeChart\Includes;

use Zabbix\Widgets\CWidgetForm;

class WidgetForm extends CWidgetForm {
}- widget 設定フォームに Description フィールドを追加します。
これは通常のテキストフィールドで、ユーザーは任意の文字セットを入力できます。
これには
CWidgetFieldTextBoxクラスを使用できます。
ui/modules/lesson_gauge_chart/includes/WidgetForm.php
<?php

namespace Modules\LessonGaugeChart\Includes;

use Zabbix\Widgets\CWidgetForm;

use Zabbix\Widgets\Fields\CWidgetFieldTextBox;

class WidgetForm extends CWidgetForm {

    public function addFields(): self {
        return $this
            ->addField(
               new CWidgetFieldTextBox('description', _('Description'))
            );
   }
}viewsディレクトリに widget 設定ビュー用のwidget.edit.phpファイルを作成し、新しい Description フィールドのビューを追加します。CWidgetFieldTextBoxフィールドクラスのビューはCWidgetFieldTextBoxViewです。
ui/modules/lesson_gauge_chart/views/widget.edit.php
<?php

/**
 * Gauge chart widget form view.
 *
 * @var CView $this
 * @var array $data
 */

(new CWidgetFormView($data))
    ->addField(
        new CWidgetFieldTextBoxView($data['fields']['description'])
    )
->show();-
ダッシュボードに移動し、widget の歯車アイコンをクリックして widget 設定フォームを開きます。
-
widget 設定フォームに新しい Description テキストフィールドが追加されています。 たとえば Gauge chart description など、任意の値を入力します。
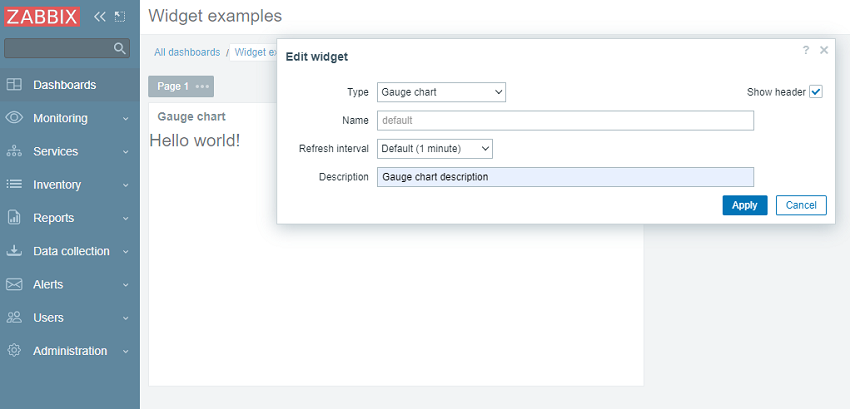
- widget 設定フォームで Apply をクリックします。 その後、右上の Save changes をクリックしてダッシュボードを保存します。 新しい説明はどこにも表示されず、widget には引き続き "Hello, world!" が表示されていることに注意してください。
新しい説明を widget に表示するには、Description フィールドの値をデータベースから取得し、widget view に渡す必要があります。 そのために、action クラスを作成します。
-
lesson_gauge_chartディレクトリ内に新しいactionsディレクトリを作成します。 -
actionsディレクトリにWidgetView.phpファイルを作成します。WidgetViewaction クラスはCControllerDashboardWidgetViewクラスを継承します。
widget 設定フィールドの値は、action クラスの $fields_values プロパティに保存されます。
ui/modules/lesson_gauge_chart/actions/WidgetView.php
<?php

namespace Modules\LessonGaugeChart\Actions;

use CControllerDashboardWidgetView,
    CControllerResponseData;

class WidgetView extends CControllerDashboardWidgetView {

    protected function doAction(): void {
        $this->setResponse(new CControllerResponseData([
            'name' => $this->getInput('name', $this->widget->getName()),
            'description' => $this->fields_values['description'],
            'user' => [
                'debug_mode' => $this->getDebugMode()
            ]
        ]));
    }
}manifest.jsonを開き、actions/widget.lesson_gauge_chart.viewセクションにWidgetViewを action クラスとして登録します。
ui/modules/lesson_gauge_chart/manifest.json
{
    "manifest_version": 2.0,
    "id": "lesson_gauge_chart",
    "type": "widget",
    "name": "Gauge chart",
    "namespace": "LessonGaugeChart",
    "version": "1.0",
    "author": "Zabbix",
    "actions": {
        "widget.lesson_gauge_chart.view": {
            "class": "WidgetView"
        }
    }
}- これで、
$data['description']に含まれる description フィールドの値を widget view で使用できるようになります。views/widget.view.phpを開き、静的テキスト "Hello, world!" を$data['description']に置き換えます。
ui/modules/lesson_gauge_chart/views/widget.view.php
<?php

/**
 * Gauge chart widget view.
 *
 * @var CView $this
 * @var array $data
 */

(new CWidgetView($data))
    ->addItem(
        new CTag('h1', true, $data['description'])
    )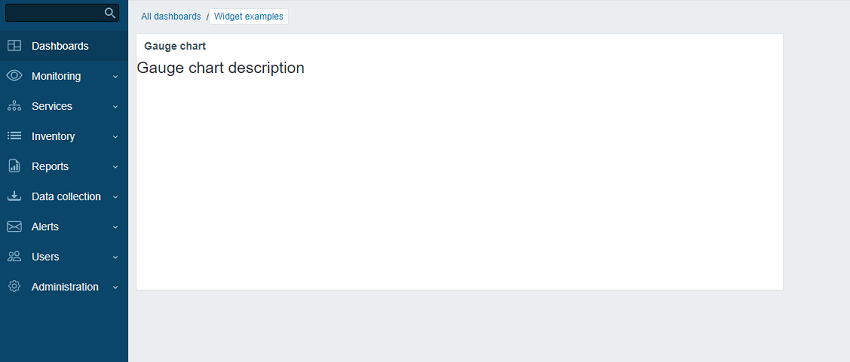
->show();- ダッシュボードページを更新します。 これで "Hello, world!" の代わりに widget の説明テキストが表示されるはずです。
API経由でアイテムの値を取得する
このウィジェットは、ユーザーが選択したアイテムの最新値を表示する必要があります。
そのため、ウィジェット設定でアイテムを選択できるようにする必要があります。
このセクションでは、ウィジェットフォームにアイテム選択フィールドを追加する方法と、そのフィールドの表示要素を設定画面に追加する方法を学びます。
その後、ウィジェットコントローラーはAPIリクエストを通じてアイテムデータとその値を取得できるようになります。
取得した値は、ウィジェット表示画面に表示できます。
includes/WidgetForm.phpを開き、CWidgetFieldMultiSelectItemフィールドを追加します。
これにより、設定フォームでアイテムを選択できるようになります。
ui/modules/lesson_gauge_chart/includes/WidgetForm.php
<?php

namespace Modules\LessonGaugeChart\Includes;

use Zabbix\Widgets\{
    CWidgetField,
    CWidgetForm
};

use Zabbix\Widgets\Fields\{
    CWidgetFieldMultiSelectItem,
    CWidgetFieldTextBox
};

/**
 * Gauge chart widget form.
 */
class WidgetForm extends CWidgetForm {

    public function addFields(): self {
        return $this
            ->addField(
                (new CWidgetFieldMultiSelectItem('itemid', _('Item')))
                    ->setFlags(CWidgetField::FLAG_NOT_EMPTY | CWidgetField::FLAG_LABEL_ASTERISK)
                    ->setMultiple(false)
            )
            ->addField(
                new CWidgetFieldTextBox('description', _('Description'))
            );
    }
}views/widget.edit.phpを開き、フィールドの表示コンポーネントを設定画面に追加します。
ui/modules/lesson_gauge_chart/views/widget.edit.php
<?php

/**
 * Gauge chart widget form view.
 *
 * @var CView $this
 * @var array $data
 */

(new CWidgetFormView($data))
    ->addField(
        new CWidgetFieldMultiSelectItemView($data['fields']['itemid'])
    )
    ->addField(
        new CWidgetFieldTextBoxView($data['fields']['description'])
    )
->show();-
ダッシュボードに戻り、ウィジェット内の歯車アイコンをクリックして、ウィジェット設定フォームを開きます。
-
ウィジェット設定フォームに新しい入力フィールド Item が追加されています。
ホスト "Zabbix server" とアイテム "Load average (1m avg)" を選択します。
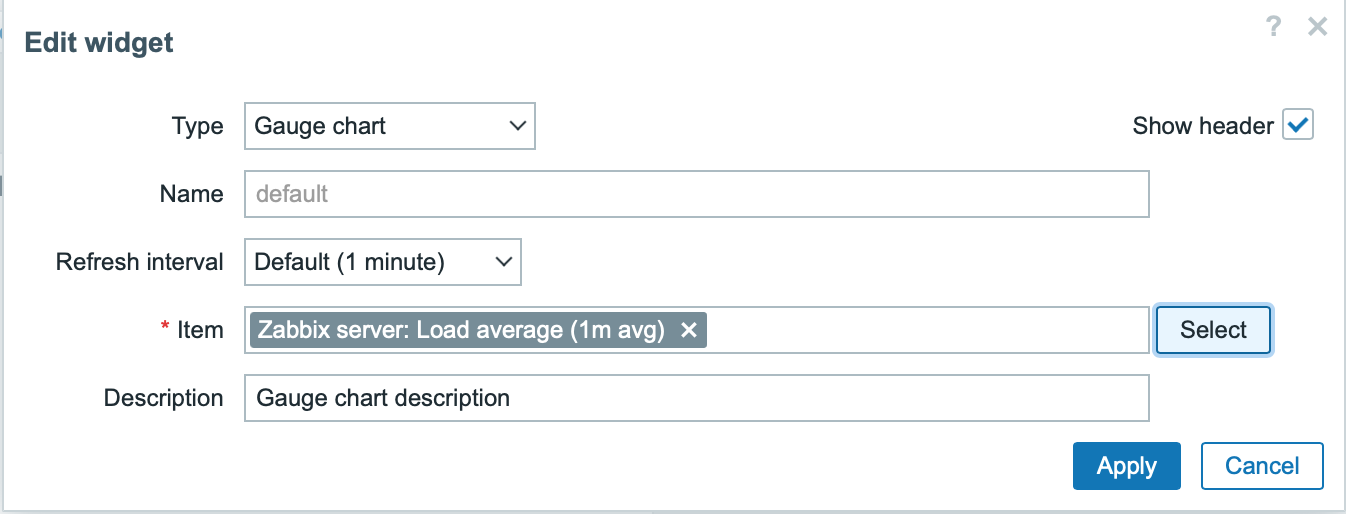
-
ウィジェット設定フォームで Apply をクリックします。
その後、右上隅の Save changes をクリックしてダッシュボードを保存します。 -
actions/WidgetView.phpを開いて修正します。
これ以降、アイテムIDはウィジェットコントローラー内の $this->fields_values['itemid'] で利用できるようになります。
doAction() コントローラーメソッドは、APIメソッド item.get を使用してアイテムデータ(名前、値の型、単位)を取得し、APIメソッド history.get を使用してアイテムの最新値を取得します。
ui/modules/lesson_gauge_chart/actions/WidgetView.php
<?php

namespace Modules\LessonGaugeChart\Actions;

use API,
    CControllerDashboardWidgetView,
    CControllerResponseData;

class WidgetView extends CControllerDashboardWidgetView {

    protected function doAction(): void {
        $db_items = API::Item()->get([
            'output' => ['itemid', 'value_type', 'name', 'units'],
            'itemids' => $this->fields_values['itemid'],
            'webitems' => true,
            'filter' => [
                'value_type' => [ITEM_VALUE_TYPE_UINT64, ITEM_VALUE_TYPE_FLOAT]
            ]
        ]);

        $value = null;

        if ($db_items) {
            $item = $db_items[0];

            $history = API::History()->get([
                'output' => API_OUTPUT_EXTEND,
                'itemids' => $item['itemid'],
                'history' => $item['value_type'],
                'sortfield' => 'clock',
                'sortorder' => ZBX_SORT_DOWN,
                'limit' => 1
            ]);

            if ($history) {
                $value = convertUnitsRaw([
                    'value' => $history[0]['value'],
                    'units' => $item['units']
                ]);
            }
        }

        $this->setResponse(new CControllerResponseData([
            'name' => $this->getInput('name', $this->widget->getName()),
            'value' => $value,
            'description' => $this->fields_values['description'],
            'user' => [
                'debug_mode' => $this->getDebugMode()
            ]
        ]));
    }
}views/widget.view.phpを開き、アイテムの値をウィジェット表示に追加します。
ui/modules/lesson_gauge_chart/views/widget.view.php
<?php

/**
 * Gauge chart widget view.
 *
 * @var CView $this
 * @var array $data
 */

(new CWidgetView($data))
    ->addItem([
        new CTag('h1', true, $data['description']),
        new CDiv($data['value'] !== null ? $data['value']['value'] : _('No data'))
    ])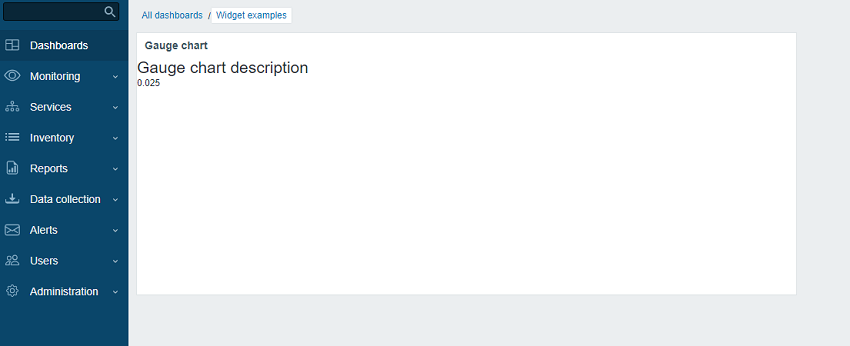
->show();- ダッシュボードページを更新します。
ウィジェットにアイテムの最新値が表示されます。
設定ビューに詳細設定を追加する
このセクションでは、色、最小値と最大値、単位、そして前の手順で作成した Description フィールドなどの任意パラメータを含む、展開/折りたたみ可能な Advanced configuration セクションを追加する方法を学びます。
- メインのウィジェットディレクトリ
lesson_gauge_chartにWidget.phpファイルを作成し、新しいWidgetクラスを定義します。
Widget クラスは CWidget 基底クラスを継承し、既定のウィジェット設定(この場合は翻訳)を追加/上書きします。以下に示す JavaScript は、データがない場合に文字列 "No data" を表示します。
"No data" 文字列は Zabbix の UI 翻訳ファイルに含まれています。
ウィジェット定数がある場合は、それらも Widget クラスで定義することを推奨します。
ui/modules/lesson_gauge_chart/Widget.php
<?php

namespace Modules\LessonGaugeChart;

use Zabbix\Core\CWidget;

class Widget extends CWidget {

    public const UNIT_AUTO = 0;
    public const UNIT_STATIC = 1;

    public function getTranslationStrings(): array {
        return [
            'class.widget.js' => [
                'No data' => _('No data')
            ]
        ];
    }
}includes/WidgetForm.phpを開き、新しいフィールド Color(カラーピッカー)、Min(数値フィールド)、Max(数値フィールド)、Units(選択)を追加し、次の手順で使用できるようにカラーピッカーの既定のカラーパレットを定義します。
ui/modules/lesson_gauge_chart/includes/WidgetForm.php
<?php

namespace Modules\LessonGaugeChart\Includes;

use Modules\LessonGaugeChart\Widget;

use Zabbix\Widgets\{
    CWidgetField,
    CWidgetForm
};

use Zabbix\Widgets\Fields\{
    CWidgetFieldColor,
    CWidgetFieldMultiSelectItem,
    CWidgetFieldNumericBox,
    CWidgetFieldSelect,
    CWidgetFieldTextBox
};

/**
 * Gauge chart widget form.
 */
class WidgetForm extends CWidgetForm {

    public const DEFAULT_COLOR_PALETTE = [
        'FF465C', 'B0AF07', '0EC9AC', '524BBC', 'ED1248', 'D1E754', '2AB5FF', '385CC7', 'EC1594', 'BAE37D',
        '6AC8FF', 'EE2B29', '3CA20D', '6F4BBC', '00A1FF', 'F3601B', '1CAE59', '45CFDB', '894BBC', '6D6D6D'
    ];

    public function addFields(): self {
        return $this
            ->addField(
                (new CWidgetFieldMultiSelectItem('itemid', _('Item')))
                    ->setFlags(CWidgetField::FLAG_NOT_EMPTY | CWidgetField::FLAG_LABEL_ASTERISK)
                    ->setMultiple(false)
            )
            ->addField(
                (new CWidgetFieldColor('chart_color', _('Color')))->setDefault('FF0000')
            )
            ->addField(
                (new CWidgetFieldNumericBox('value_min', _('Min')))
                    ->setDefault(0)
                    ->setFlags(CWidgetField::FLAG_NOT_EMPTY | CWidgetField::FLAG_LABEL_ASTERISK)
            )
            ->addField(
                (new CWidgetFieldNumericBox('value_max', _('Max')))
                    ->setDefault(100)
                    ->setFlags(CWidgetField::FLAG_NOT_EMPTY | CWidgetField::FLAG_LABEL_ASTERISK)
            )
            ->addField(
                (new CWidgetFieldSelect('value_units', _('Units'), [
                    Widget::UNIT_AUTO => _x('Auto', 'history source selection method'),
                    Widget::UNIT_STATIC => _x('Static', 'history source selection method')
                ]))->setDefault(Widget::UNIT_AUTO)
            )
            ->addField(
                (new CWidgetFieldTextBox('value_static_units'))
            )
            ->addField(
                new CWidgetFieldTextBox('description', _('Description'))
            );
    }
}views/widget.edit.phpを開き、設定ビューにフィールドの視覚コンポーネントを追加します。
ui/modules/lesson_gauge_chart/views/widget.edit.php
<?php

/**
 * Gauge chart widget form view.
 *
 * @var CView $this
 * @var array $data
 */

$lefty_units = new CWidgetFieldSelectView($data['fields']['value_units']);
$lefty_static_units = (new CWidgetFieldTextBoxView($data['fields']['value_static_units']))
    ->setPlaceholder(_('value'))
    ->setWidth(ZBX_TEXTAREA_TINY_WIDTH);

(new CWidgetFormView($data))
    ->addField(
        (new CWidgetFieldMultiSelectItemView($data['fields']['itemid']))
            ->setPopupParameter('numeric', true)
    )
    ->addFieldset(
        (new CWidgetFormFieldsetCollapsibleView(_('Advanced configuration')))
            ->addField(
                new CWidgetFieldColorView($data['fields']['chart_color'])
            )
            ->addField(
                new CWidgetFieldNumericBoxView($data['fields']['value_min'])
            )
            ->addField(
                new CWidgetFieldNumericBoxView($data['fields']['value_max'])
            )
            ->addItem([
                $lefty_units->getLabel(),
                (new CFormField([
                    $lefty_units->getView()->addClass(ZBX_STYLE_FORM_INPUT_MARGIN),
                    $lefty_static_units->getView()
                ]))
            ])
            ->addField(
                new CWidgetFieldTextBoxView($data['fields']['description'])
            )
    )
    ->show();
CWidgetFormView クラスの addField() メソッドは、2 番目のパラメータとして CSS クラス文字列を受け取ります。
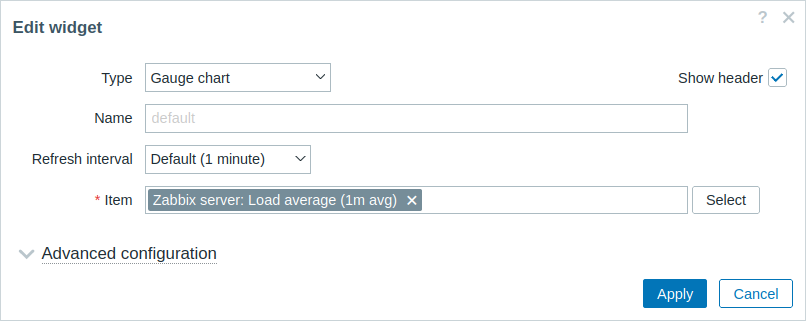
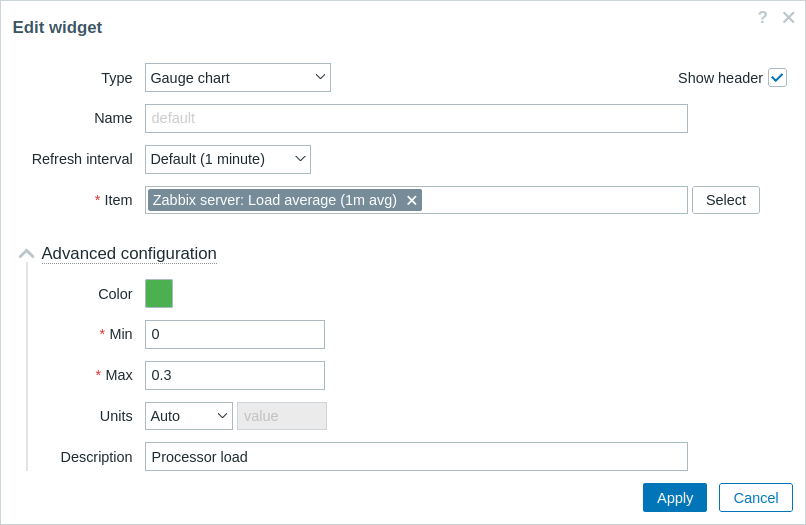
- ダッシュボードに戻り、編集モードに切り替えて、ウィジェット内の歯車アイコンをクリックし、ウィジェット設定フォームを開きます。
ウィジェット設定フォームには、新しい展開/折りたたみ可能なセクション Advanced configuration が追加されています。
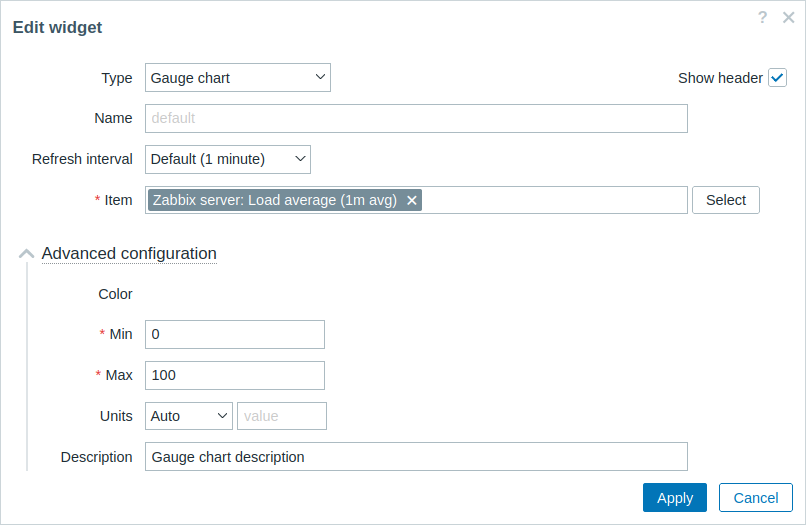
- Advanced configuration セクションを展開すると、追加のウィジェット設定フィールドが表示されます。
フィールド Color にはまだカラーピッカーがないことに注意してください。
これは、カラーピッカーを JavaScript で初期化する必要があるためです。これは次のセクション - ウィジェットに JavaScript を追加する - で追加します。
ウィジェットに JavaScript を追加する
このセクションでは、JavaScript で作成したゲージチャートを追加し、最新値が正常か、または高すぎる/低すぎるかを表示する方法を学びます。
viewsディレクトリにwidget.edit.js.phpファイルを作成します。
JavaScript は、設定画面でカラーピッカーを初期化する役割を担います。
ui/modules/lesson_gauge_chart/views/widget.edit.js.php
<?php

use Modules\LessonGaugeChart\Widget;

?>

window.widget_lesson_gauge_chart_form = new class {

    init({color_palette}) {
        this._unit_select = document.getElementById('value_units');
        this._unit_value = document.getElementById('value_static_units');

        this._unit_select.addEventListener('change', () => this.updateForm());

        colorPalette.setThemeColors(color_palette);

        for (const colorpicker of jQuery('.<?= ZBX_STYLE_COLOR_PICKER ?> input')) {
            jQuery(colorpicker).colorpicker();
        }

        const overlay = overlays_stack.getById('widget_properties');

        for (const event of ['overlay.reload', 'overlay.close']) {
            overlay.$dialogue[0].addEventListener(event, () => { jQuery.colorpicker('hide'); });
        }

        this.updateForm();
    }

    updateForm() {
        this._unit_value.disabled = this._unit_select.value == <?= Widget::UNIT_AUTO ?>;
    }
};views/widget.edit.phpを開き、widget.edit.js.phpファイルを設定画面に追加します。
これにはincludeJsFile()メソッドを使用します。
インライン JavaScript を追加するには、addJavaScript()メソッドを使用します。
ui/modules/lesson_gauge_chart/views/widget.edit.php
<?php

/**
 * Gauge chart widget form view.
 *
 * @var CView $this
 * @var array $data
 */

use Modules\LessonGaugeChart\Includes\WidgetForm;

$lefty_units = new CWidgetFieldSelectView($data['fields']['value_units']);
$lefty_static_units = (new CWidgetFieldTextBoxView($data['fields']['value_static_units']))
    ->setPlaceholder(_('value'))
    ->setWidth(ZBX_TEXTAREA_TINY_WIDTH);

(new CWidgetFormView($data))
    ->addField(
        (new CWidgetFieldMultiSelectItemView($data['fields']['itemid']))
            ->setPopupParameter('numeric', true)
    )
    ->addFieldset(
        (new CWidgetFormFieldsetCollapsibleView(_('Advanced configuration')))
            ->addField(
                new CWidgetFieldColorView($data['fields']['chart_color'])
            )
            ->addField(
                new CWidgetFieldNumericBoxView($data['fields']['value_min'])
            )
            ->addField(
                new CWidgetFieldNumericBoxView($data['fields']['value_max'])
            )
            ->addItem([
                $lefty_units->getLabel(),
                (new CFormField([
                    $lefty_units->getView()->addClass(ZBX_STYLE_FORM_INPUT_MARGIN),
                    $lefty_static_units->getView()
                ]))
            ])
            ->addField(
                new CWidgetFieldTextBoxView($data['fields']['description'])
            )
    )
    ->includeJsFile('widget.edit.js.php')
    ->addJavaScript('widget_lesson_gauge_chart_form.init('.json_encode([
        'color_palette' => WidgetForm::DEFAULT_COLOR_PALETTE
    ], JSON_THROW_ON_ERROR).');')
->show();- ダッシュボードに戻り、ウィジェット内の歯車アイコンをクリックして、ウィジェット設定フォームを開きます。
次に、Advanced configuration セクションを展開して、初期化されたカラーピッカーを表示します。
各フィールドに値を入力し、ゲージチャートの色を選択します。
-
ウィジェット設定フォームで Apply をクリックします。
その後、右上の Save changes をクリックしてダッシュボードを保存します。 -
actions/WidgetView.phpを開き、コントローラーを更新します。
$this->fields_values プロパティには、すべての Advanced configuration フィールドの値が含まれるようになっています。
設定と選択したアイテム値をウィジェットビューに渡せるよう、コントローラーを完成させます。
ui/modules/lesson_gauge_chart/actions/WidgetView.php
<?php

namespace Modules\LessonGaugeChart\Actions;

use API,
    CControllerDashboardWidgetView,
    CControllerResponseData;

class WidgetView extends CControllerDashboardWidgetView {

    protected function doAction(): void {
        $db_items = API::Item()->get([
            'output' => ['itemid', 'value_type', 'name', 'units'],
            'itemids' => $this->fields_values['itemid'],
            'webitems' => true,
            'filter' => [
                'value_type' => [ITEM_VALUE_TYPE_UINT64, ITEM_VALUE_TYPE_FLOAT]
            ]
        ]);

        $history_value = null;

        if ($db_items) {
            $item = $db_items[0];

            $history = API::History()->get([
                'output' => API_OUTPUT_EXTEND,
                'itemids' => $item['itemid'],
                'history' => $item['value_type'],
                'sortfield' => 'clock',
                'sortorder' => ZBX_SORT_DOWN,
                'limit' => 1
            ]);

            if ($history) {
                $history_value = convertUnitsRaw([
                    'value' => $history[0]['value'],
                    'units' => $item['units']
                ]);
            }
        }

        $this->setResponse(new CControllerResponseData([
            'name' => $this->getInput('name', $this->widget->getName()),
            'history' => $history_value,
            'fields_values' => $this->fields_values,
            'user' => [
                'debug_mode' => $this->getDebugMode()
            ]
        ]));
    }
}views/widget.view.phpを開いて修正します。
次の手順で描画するゲージチャート用のコンテナと、説明用のコンテナを作成する必要があります。
JavaScript に値を JSON オブジェクトとして渡すには、setVar() メソッドを使用します。
ui/modules/lesson_gauge_chart/views/widget.view.php
<?php

/**
 * Gauge chart widget view.
 *
 * @var CView $this
 * @var array $data
 */

(new CWidgetView($data))
    ->addItem([
        (new CDiv())->addClass('chart'),
        $data['fields_values']['description']
            ? (new CDiv($data['fields_values']['description']))->addClass('description')
            : null
    ])
    ->setVar('history', $data['history'])
    ->setVar('fields_values', $data['fields_values'])
->show();-
lesson_gauge_chartディレクトリに新しいassetsディレクトリを作成します。
このディレクトリは、JavaScript、CSS、さらにフォントや画像などの他のアセットを保存するために使用します。 -
ウィジェットビュー用の JavaScript のために、
assetsディレクトリ内にjsディレクトリを作成します。 -
assets/jsディレクトリにclass.widget.jsファイルを作成します。
この JavaScript ウィジェットクラスは、すべてのダッシュボードウィジェットのベース JavaScript クラスである CWidget を継承します。
ダッシュボードは、ウィジェットの正しい実装に依存しており、各 JavaScript メソッドを呼び出すことで、関連する情報をウィジェットに伝えます。
また、ダッシュボードは、何らかの操作が発生したときにウィジェットがイベントを生成することも期待しています。
そのため、CWidget クラスには、ウィジェットの動作のデフォルト実装を持つ一連のメソッドが含まれており、クラスを継承することでカスタマイズできます。
このケースではカスタマイズが必要なため、次のウィジェット動作について独自ロジックを実装します。
- ウィジェットの初期化。ウィジェットの初期状態を定義する役割があります(
onInitialize()メソッドを参照)。 - ウィジェット更新処理が成功し、エラーがない場合のウィジェット内容の表示、つまりゲージチャートの描画(
processUpdateResponse(response)メソッド、および関連する_resizeChart()と_updatedChart()メソッドを参照)。 - ウィジェットのサイズ変更(
onResize()メソッド、および関連する_resizeChart()メソッドを参照)。
ゲージチャートウィジェットのその他の側面については、ウィジェット動作のデフォルト実装を使用します。
CWidget クラスの JavaScript メソッドの詳細については、JavaScript を参照してください。
この JavaScript はウィジェットビューに必要なため、ダッシュボードページと一緒に読み込まれる必要があります。
JavaScript の読み込みを有効にするには、手順 10 に示すように assets/js と js_class パラメータを manifest.json ファイルで更新する必要があります。
ui/modules/lesson_gauge_chart/assets/js/class.widget.js
class WidgetLessonGaugeChart extends CWidget {

    static UNIT_AUTO = 0;
    static UNIT_STATIC = 1;

    onInitialize() {
        super.onInitialize();

        this._refresh_frame = null;
        this._chart_container = null;
        this._canvas = null;
        this._chart_color = null;
        this._min = null;
        this._max = null;
        this._value = null;
        this._last_value = null;
        this._units = '';
    }

    processUpdateResponse(response) {
        if (response.history === null) {
            this._value = null;
            this._units = '';
        }
        else {
            this._value = Number(response.history.value);
            this._units = response.fields_values.value_units == WidgetLessonGaugeChart.UNIT_AUTO
                ? response.history.units
                : response.fields_values.value_static_units;
        }

        this._chart_color = response.fields_values.chart_color;
        this._min = Number(response.fields_values.value_min);
        this._max = Number(response.fields_values.value_max);

        super.processUpdateResponse(response);
    }

    setContents(response) {
        if (this._canvas === null) {
            super.setContents(response);

            this._chart_container = this._body.querySelector('.chart');
            this._chart_container.style.height =
                `${this._getContentsSize().height - this._body.querySelector('.description').clientHeight}px`;
            this._canvas = document.createElement('canvas');

            this._chart_container.appendChild(this._canvas);

            this._resizeChart();
        }

        this._updatedChart();
    }

    onResize() {
        super.onResize();

        if (this._state === WIDGET_STATE_ACTIVE) {
            this._resizeChart();
        }
    }

    _resizeChart() {
        const ctx = this._canvas.getContext('2d');
        const dpr = window.devicePixelRatio;

        this._canvas.style.display = 'none';
        const size = Math.min(this._chart_container.offsetWidth, this._chart_container.offsetHeight);
        this._canvas.style.display = '';

        this._canvas.width = size * dpr;
        this._canvas.height = size * dpr;

        ctx.scale(dpr, dpr);

        this._canvas.style.width = `${size}px`;
        this._canvas.style.height = `${size}px`;

        this._refresh_frame = null;

        this._updatedChart();
    }

    _updatedChart() {
        if (this._last_value === null) {
            this._last_value = this._min;
        }

        const start_time = Date.now();
        const end_time = start_time + 400;

        const animate = () => {
            const time = Date.now();

            if (time <= end_time) {
                const progress = (time - start_time) / (end_time - start_time);
                const smooth_progress = 0.5 + Math.sin(Math.PI * (progress - 0.5)) / 2;
                let value = this._value !== null ? this._value : this._min;
                value = (this._last_value + (value - this._last_value) * smooth_progress - this._min) / (this._max - this._min);

                const ctx = this._canvas.getContext('2d');
                const size = this._canvas.width;
                const char_weight = size / 12;
                const char_shadow = 3;
                const char_x = size / 2;
                const char_y = size / 2;
                const char_radius = (size - char_weight) / 2 - char_shadow;

                const font_ratio = 32 / 100;

                ctx.clearRect(0, 0, size, size);

                ctx.beginPath();
                ctx.shadowBlur = char_shadow;
                ctx.shadowColor = '#bbb';
                ctx.strokeStyle = '#eee';
                ctx.lineWidth = char_weight;
                ctx.lineCap = 'round';
                ctx.arc(char_x, char_y, char_radius, Math.PI * 0.749, Math.PI * 2.251, false);
                ctx.stroke();

                ctx.beginPath();
                ctx.strokeStyle = `#${this._chart_color}`;
                ctx.lineWidth = char_weight - 2;
                ctx.lineCap = 'round';
                ctx.arc(char_x, char_y, char_radius, Math.PI * 0.75,
                    Math.PI * (0.75 + (1.5 * Math.min(1, Math.max(0, value)))), false
                    );
                ctx.stroke();

                ctx.shadowBlur = 2;
                ctx.fillStyle = '#1f2c33';
                ctx.font = `${(char_radius * font_ratio)|0}px Arial`;
                ctx.textAlign = 'center';
                ctx.textBaseline = 'middle';
                ctx.fillText(`${this._value !== null ? this._value : t('No data')}${this._units}`,
                    char_x, char_y, size - char_shadow * 4 - char_weight * 2
                );

                ctx.fillStyle = '#768d99';
                ctx.font = `${(char_radius * font_ratio * .5)|0}px Arial`;
                ctx.textBaseline = 'top';

                ctx.textAlign = 'left';
                ctx.fillText(`${this._min}${this._min != '' ? this._units : ''}`,
                    char_weight * .75, size - char_weight * 1.25, size / 2 - char_weight
                );

                ctx.textAlign = 'right';
                ctx.fillText(`${this._max}${this._max != '' ? this._units : ''}`,
                    size - char_weight * .75, size - char_weight * 1.25, size / 2 - char_weight
                );

                requestAnimationFrame(animate);
            }
            else {
                this._last_value = this._value;
            }
        };

        requestAnimationFrame(animate);
    }
}manifest.jsonを開き、次を追加します。
assets/jsセクションの配列にファイル名 (class.widget.js) を追加する。widgetセクションのjs_classパラメータにクラス名 (WidgetLessonGaugeChart) を追加する。
これで WidgetLessonGaugeChart クラスはダッシュボードと一緒に自動的に読み込まれるようになります。
ui/modules/lesson_gauge_chart/manifest.json
{
    "manifest_version": 2.0,
    "id": "lesson_gauge_chart",
    "type": "widget",
    "name": "Gauge chart",
    "namespace": "LessonGaugeChart",
    "version": "1.0",
    "author": "Zabbix",
    "actions": {
        "widget.lesson_gauge_chart.view": {
            "class": "WidgetView"
        }
    },
    "widget": {
        "js_class": "WidgetLessonGaugeChart"
    },
    "assets": {
        "js": ["class.widget.js"]
    }
}
ウィジェットに CSS スタイルを追加する
このセクションでは、カスタム CSS スタイルを追加してウィジェットの見た目をより魅力的にする方法を学びます。
-
ウィジェットのスタイル用に、
assetsディレクトリ内に新しいcssディレクトリを作成します。 -
assets/cssディレクトリにwidget.cssファイルを作成します。
ウィジェット要素のスタイル設定には、セレクタdiv.dashboard-widget-{widget id}を使用します。
ウィジェット全体の CSS を設定するには、セレクタform.dashboard-widget-{widget id}を使用します。
ui/modules/lesson_gauge_chart/assets/css/widget.css
div.dashboard-widget-lesson_gauge_chart {
    display: grid;
    grid-template-rows: 1fr;
    padding: 0;
}

div.dashboard-widget-lesson_gauge_chart .chart {
    display: grid;
    align-items: center;
    justify-items: center;
}

div.dashboard-widget-lesson_gauge_chart .chart canvas {
    background: white;
}

div.dashboard-widget-lesson_gauge_chart .description {
    padding-bottom: 8px;
    font-size: 1.750em;
    line-height: 1.2;
    text-align: center;
}

.dashboard-grid-widget-hidden-header div.dashboard-widget-lesson_gauge_chart .chart {
    margin-top: 8px;
}manifest.jsonを開き、assets/cssセクションの配列に CSS ファイル名 (widget.css) を追加します。
これにより、widget.cssで定義された CSS スタイルがダッシュボードページとともに読み込まれるようになります。
ui/modules/lesson_gauge_chart/manifest.json
{
    "manifest_version": 2.0,
    "id": "lesson_gauge_chart",
    "type": "widget",
    "name": "Gauge chart",
    "namespace": "LessonGaugeChart",
    "version": "1.0",
    "author": "Zabbix",
    "actions": {
        "widget.lesson_gauge_chart.view": {
            "class": "WidgetView"
        }
    },
    "widget": {
        "js_class": "WidgetLessonGaugeChart"
    },
    "assets": {
        "css": ["widget.css"],
        "js": ["class.widget.js"]
    }
}- ダッシュボードページを更新して、ウィジェットの完成版を確認します。